Published:
Last updated:
From a tweet about New York to the whole of Warsaw in pixel art. A story about open data, a lot of AI agents, and a city that turned out to be much more detailed than I thought.
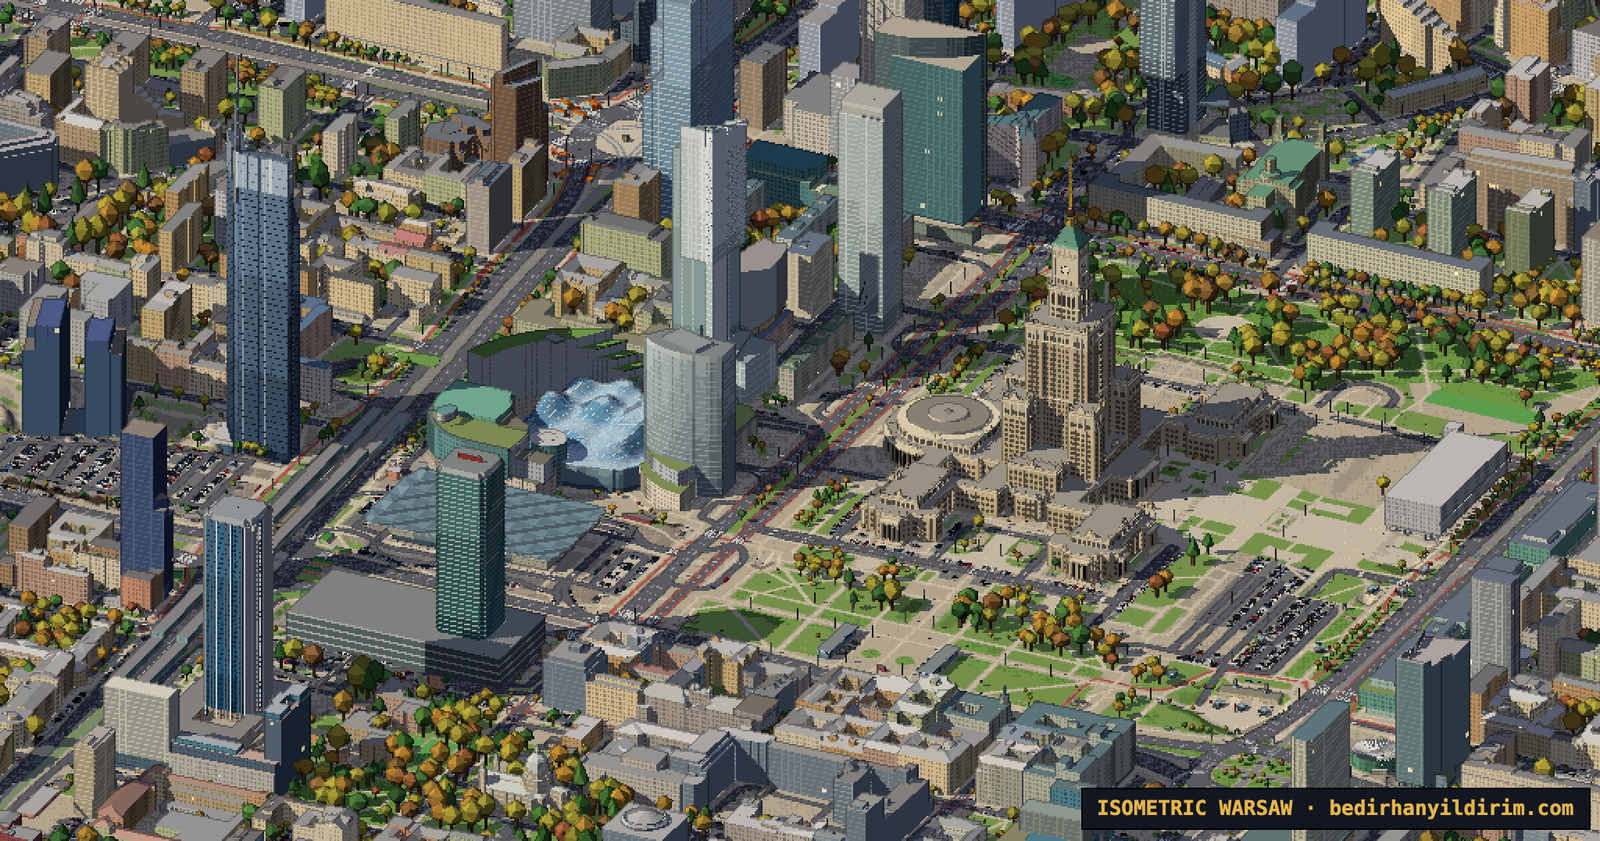
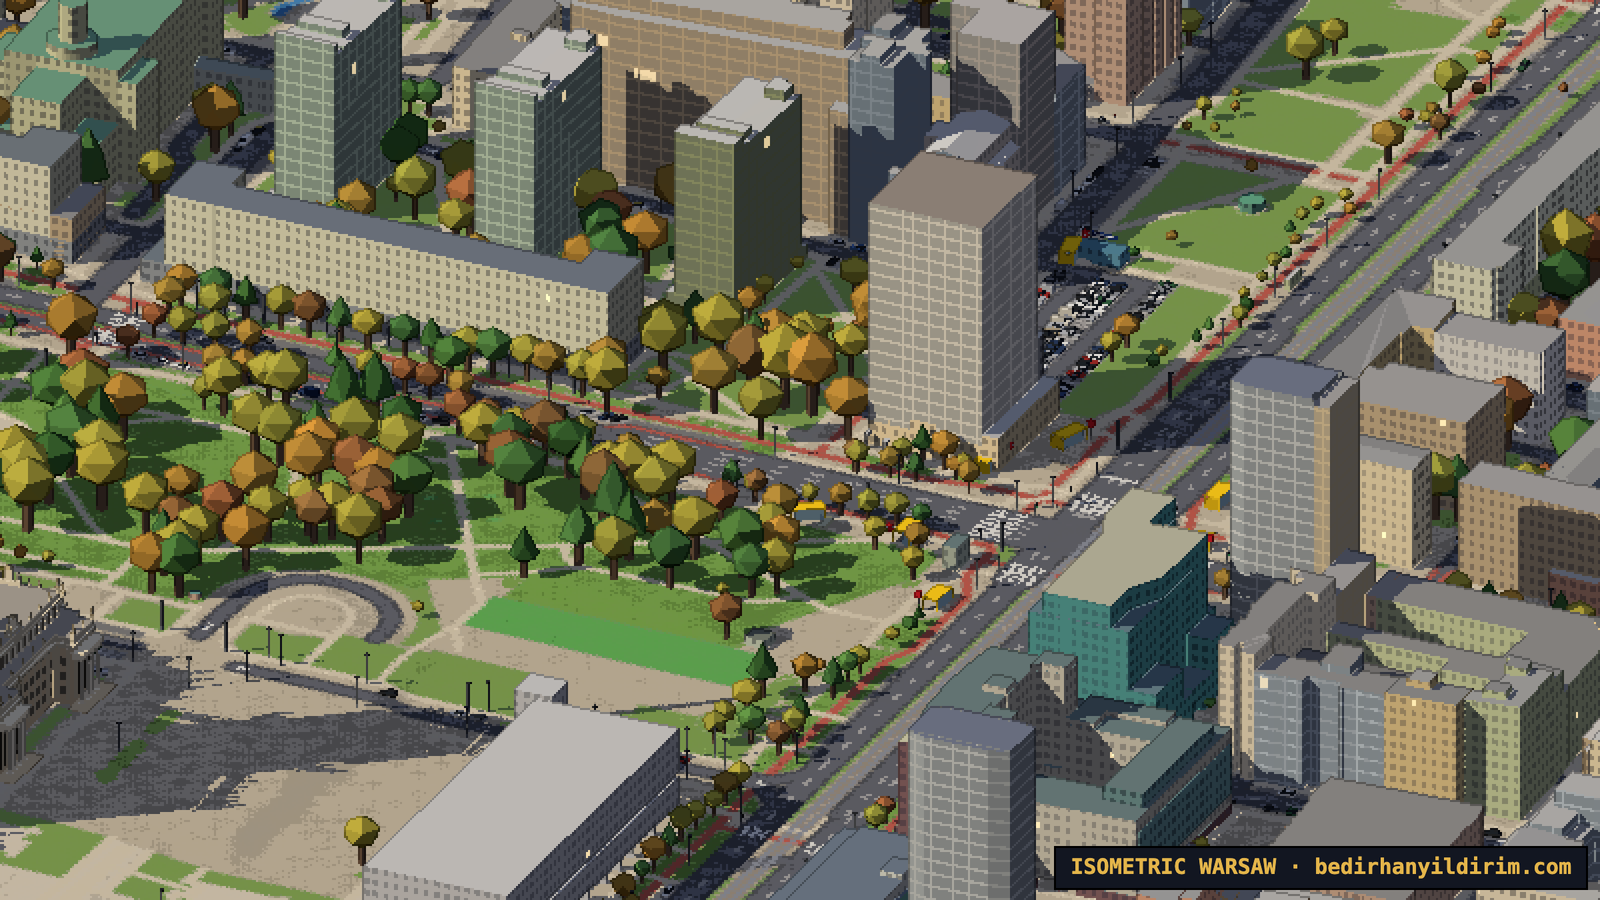
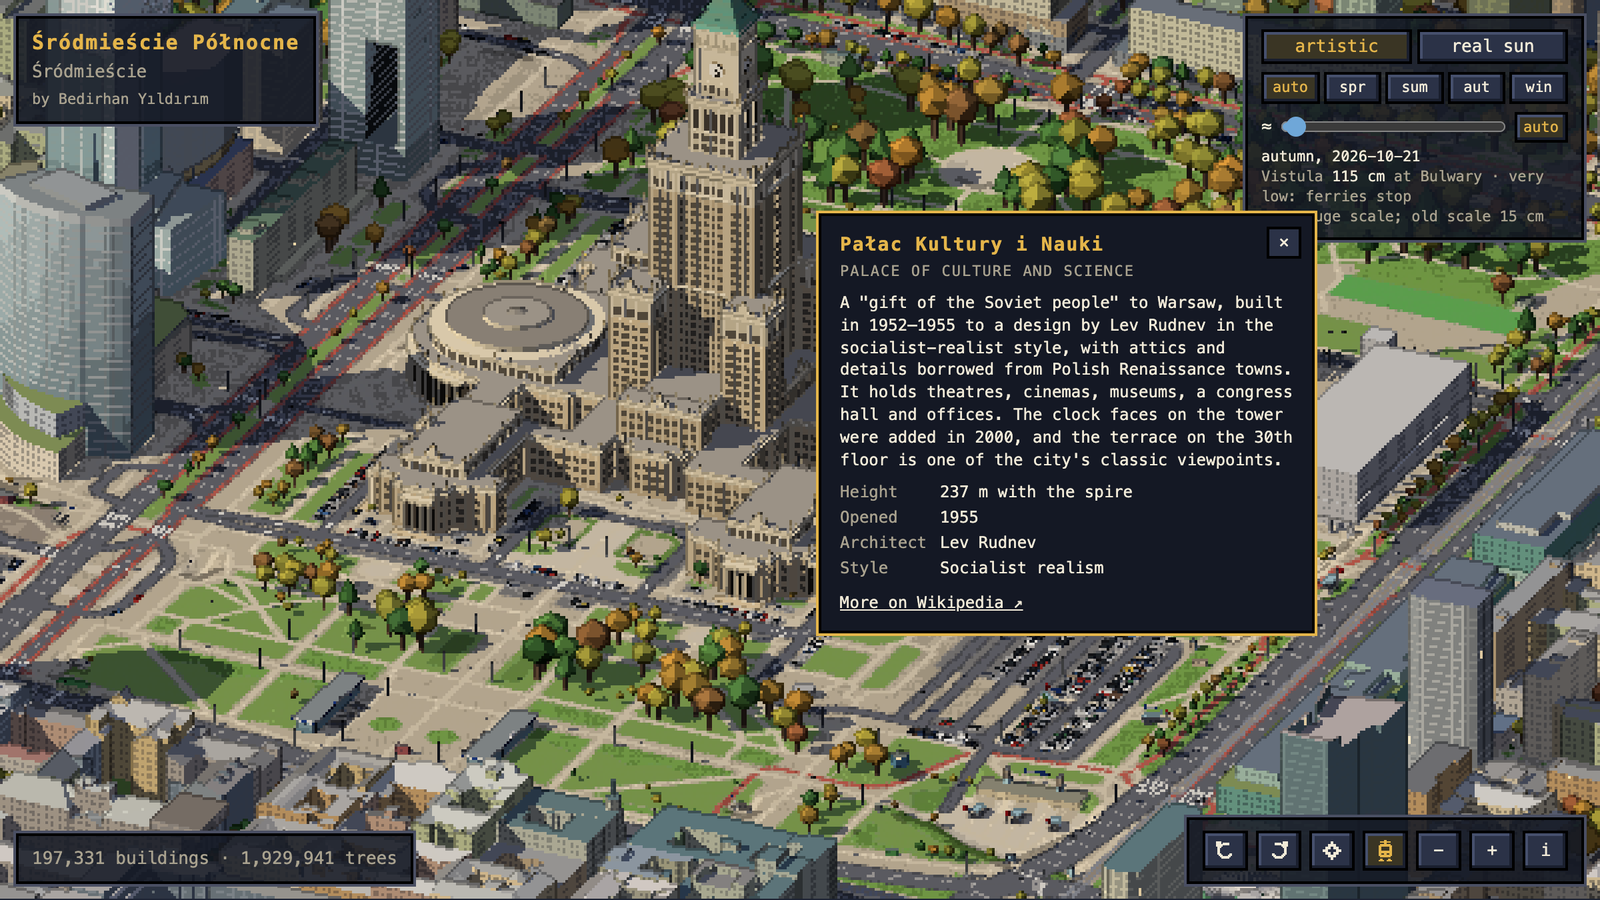
This is Isometric Warsaw: an isometric pixel-art map of the entire city that you can pan, zoom and rotate in your browser. 197,000 buildings, almost two million trees, trams and trains on their real timetables, planes landing at Chopin, ducks on Lake Balaton, the real sun for any date, and the Vistula rising and falling with the seasons.
It took two days. I didn’t write a single line of code, and apart from the hosting I already had, it didn’t cost anything.
It started with a tweet
A few days ago I opened X and saw isometric.nyc: a giant SimCity-style pixel map of New York, built with image models and coding agents. Not long after, someone did the same for London with tiny.london, and published a beautiful write-up of how they did it.
I thought: I want one of these too.
The city I really wanted to do was Istanbul. But Istanbul is huge, and a first attempt should be something I can actually finish. So I picked the city I live in: Warsaw. It is smaller, mostly flat, and I walk its streets every day.
Then we did the maths on the London approach. It uses a paid image model to create thousands of training examples and rented H100 GPUs to paint the city tile by tile. That would mean real money. I said no. If we were going to do this, it had to be free.
The trick: no image AI at all
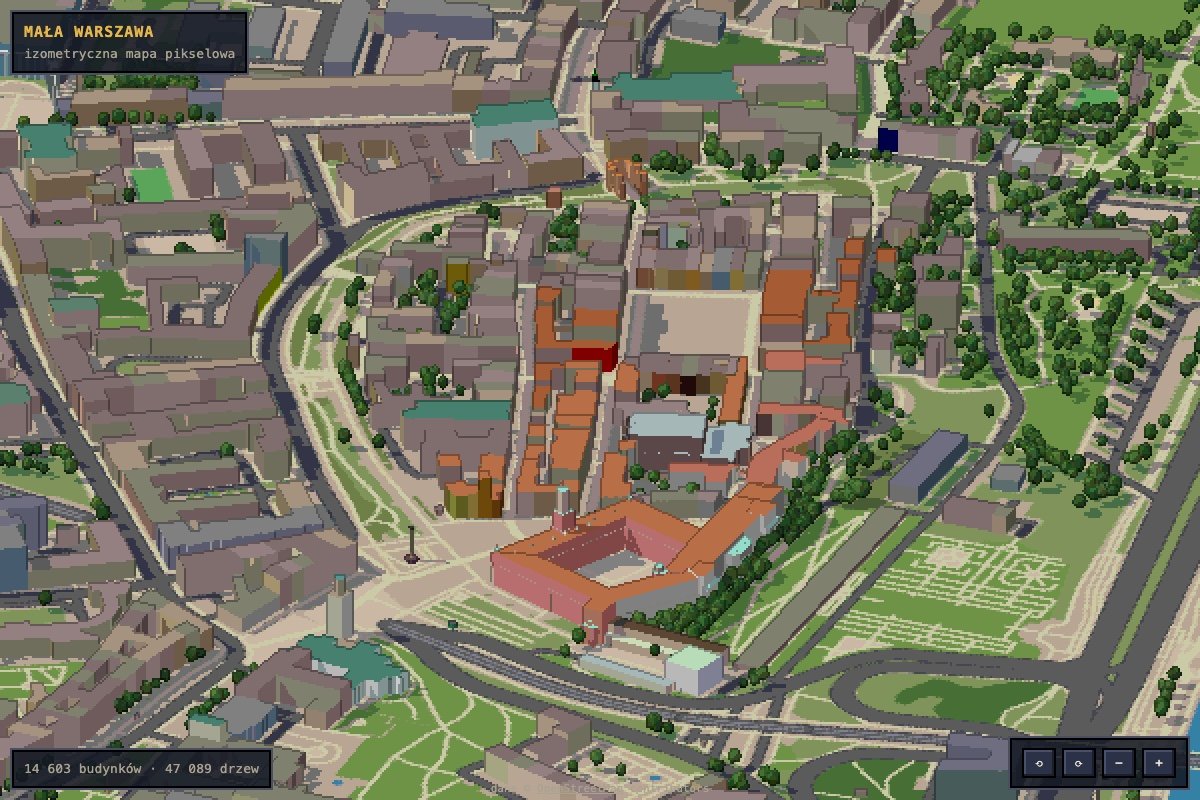
Instead of asking an AI to paint the city, we decided to draw it. The map is a real 3D scene rendered with three.js, but at half resolution, with a limited palette, dark outlines where depth jumps and every pixel snapped to a grid. The result looks hand-made, but it is pure geometry. That has some nice side effects:
- No seams between tiles, because there are no tiles. The city is drawn in one piece.
- Water is exactly where water is. The model can’t invent a boat in the middle of the Vistula.
- You can rotate it, change the time of day, add snow. A painted map can’t do that.
- It runs on my MacBook. No GPU rental, no API bills.
And Warsaw turned out to be the perfect choice for another reason: Polish open data.
Poland gives away an incredible amount of data
I didn’t know this before: GUGiK, the Polish surveying office, publishes most of its data for free, much of it under CC0. Everything on the map comes from free sources:
- OpenStreetMap for streets, buildings, water, parks, parking, street lamps, traffic lights and names.
- GUGiK’s 3D building models (LoD2) with real roof shapes: 131,686 buildings in Warsaw.
- GUGiK’s terrain model from LiDAR scans, at 1 m resolution. This is what puts the Old Town on top of the Vistula escarpment.
- GUGiK’s orthophoto, which we used to sample the real colour of each roof.
- GUGiK’s 3D tree models: 1.93 million individual trees with their height. The download was 8.5 GB; we read it as a stream and deleted it afterwards.
- ZTM Warsaw and PKP timetables (via the GTFS feeds by Mikołaj Kuranowski) for the trams and trains.
The whole city is split into 659 squares of 1 km. Your browser only loads the squares you are looking at.
How I worked: many agents, one art director
I used Claude Code as my engineer. But not as one assistant: most of the time six to eight AI agents were working in parallel, each on its own copy of the project. One was parsing the 3D buildings, one was downloading the orthophoto, one was modelling the Palace of Culture, one was building the trams, one was expanding the map to the whole city.
My job was something like an art director. I looked at screenshots and said what was wrong. A lot of the work was exactly that: “this bridge looks absurd”, “the road shouldn’t touch the ground here”, “the Old Town is supposed to be up on the hill”, “the Palace of Culture is not detailed enough, look at high-resolution photos”.
The agents always took screenshots of their own work and judged it before reporting back. Still, things went wrong. At one point an agent temporarily reverted a file to take a “before” screenshot and wiped another agent’s unsaved work. The map stopped loading while I was looking at it. After that, every agent got its own separate copy of the code, and work was merged only when it was finished and checked.
The city is not flat
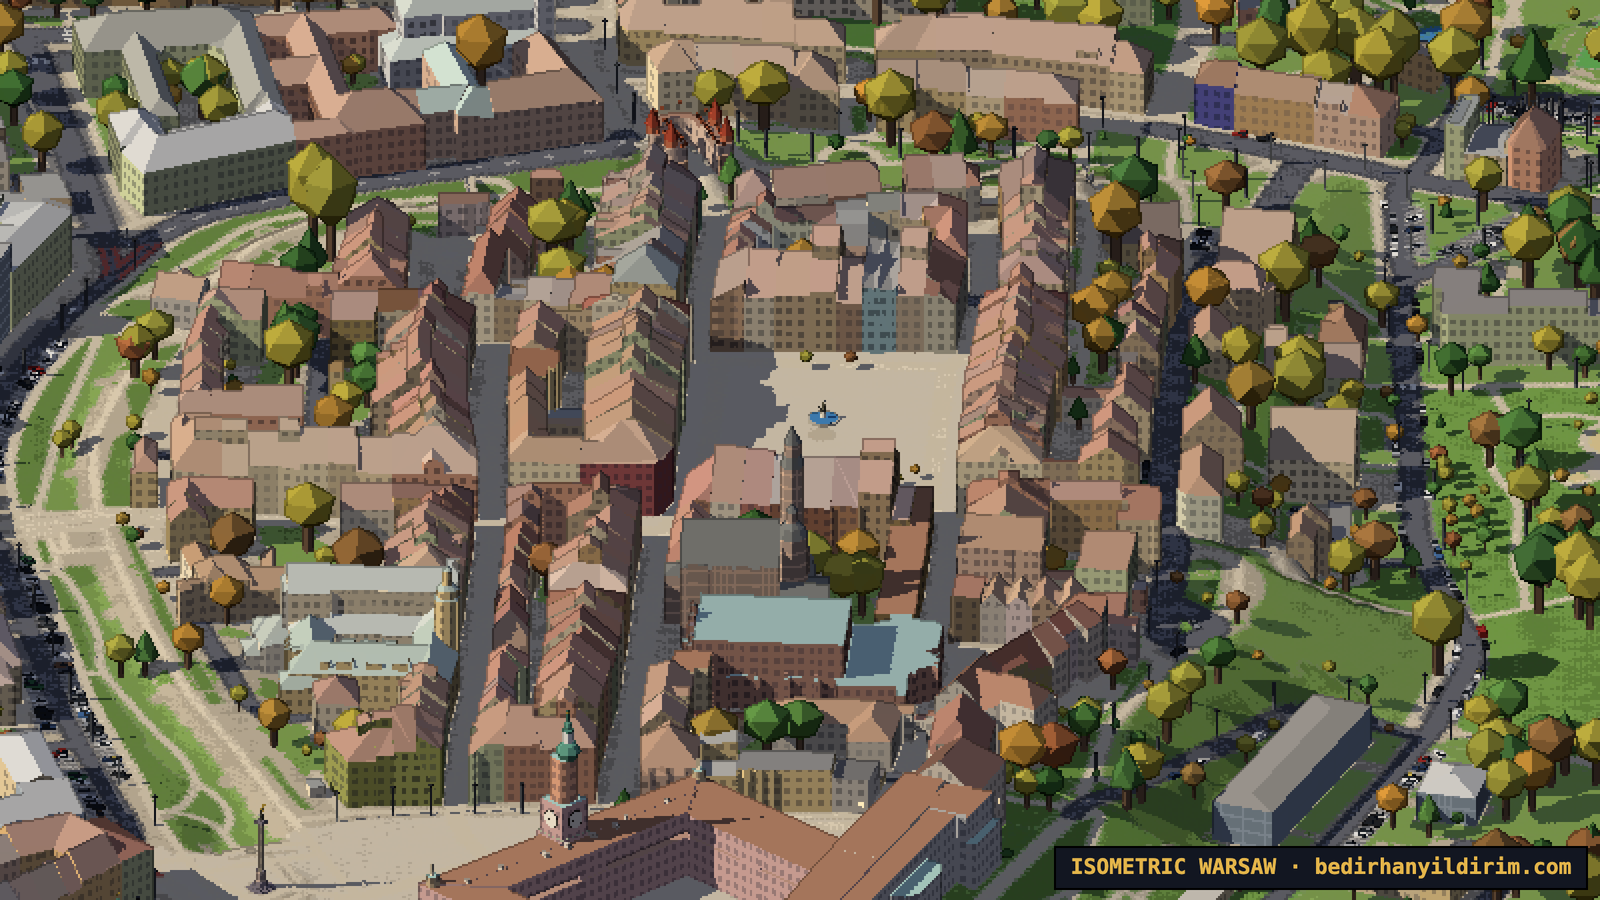
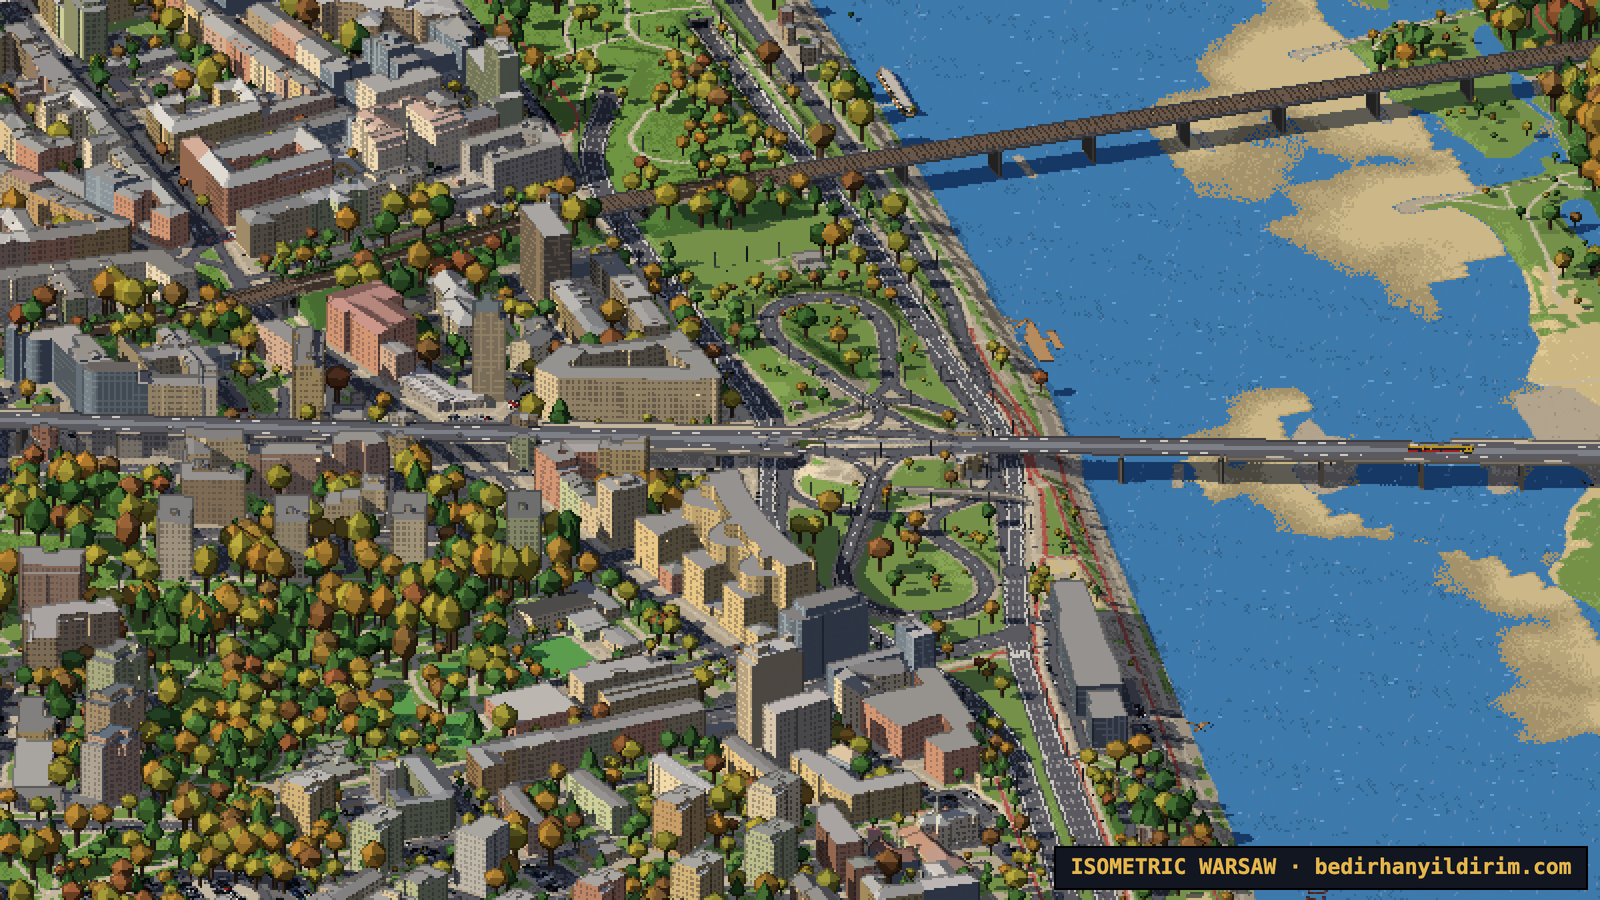
For the first day everything was on a flat plane, and the Old Town looked wrong. Trasa W-Z seemed to come out of a building in the middle of Plac Zamkowy. In reality Plac Zamkowy is about 18 metres above the road below. The road goes under the square and comes out of the escarpment.
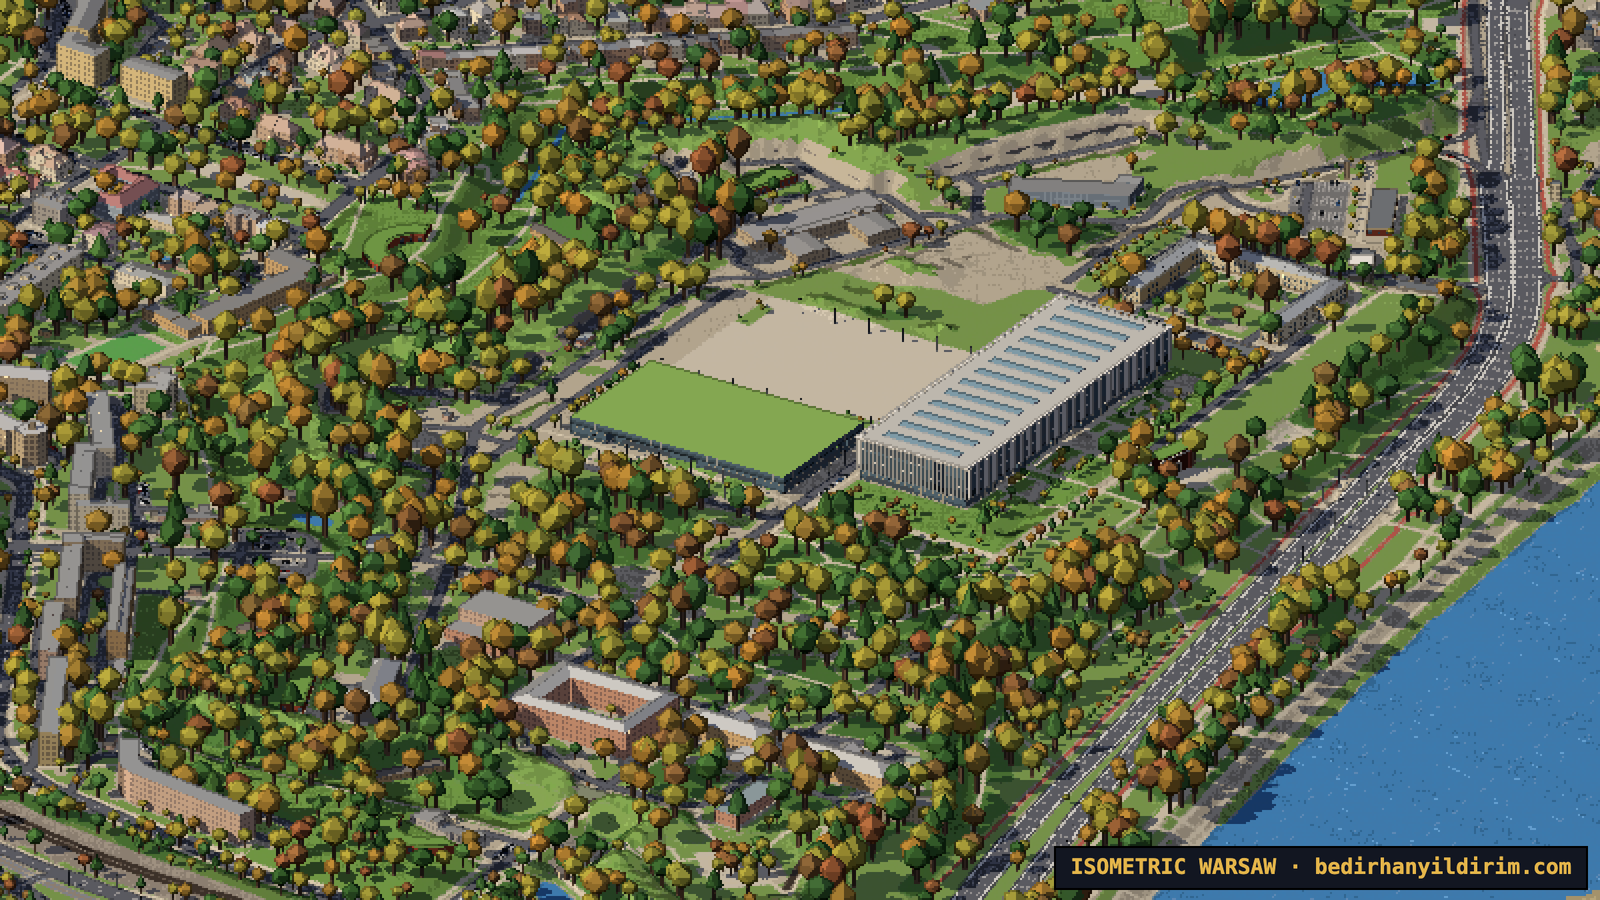
Once we added the terrain model, the Old Town moved up onto its hill, Powiśle went down to the river, and Stadion Narodowy now sits on the embankment of the old Stadion Dziesięciolecia.
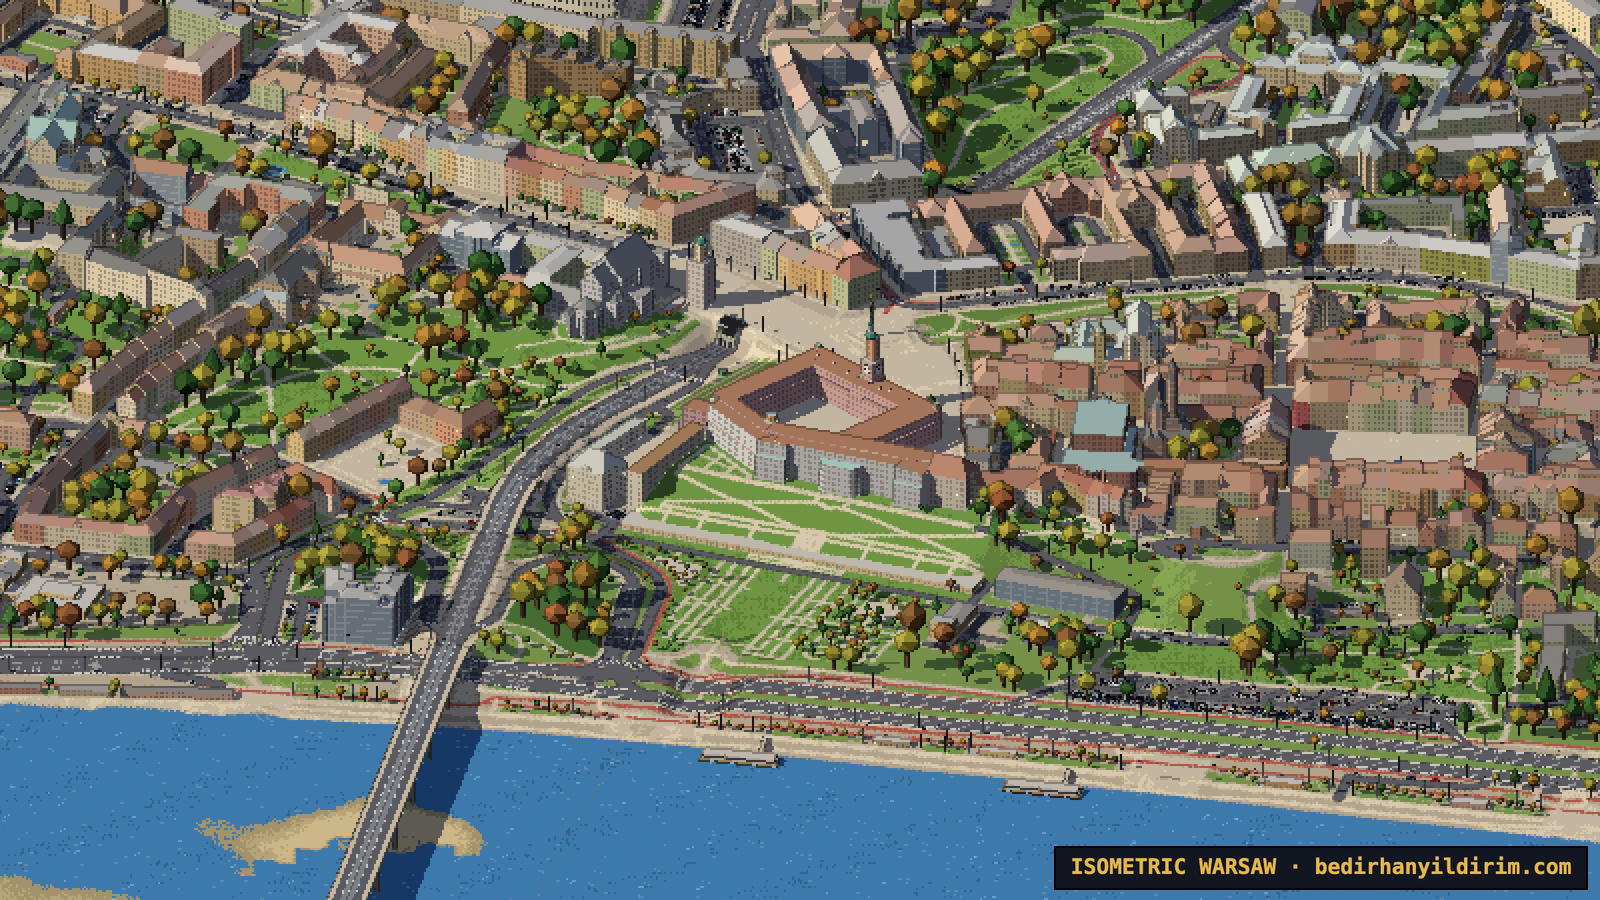
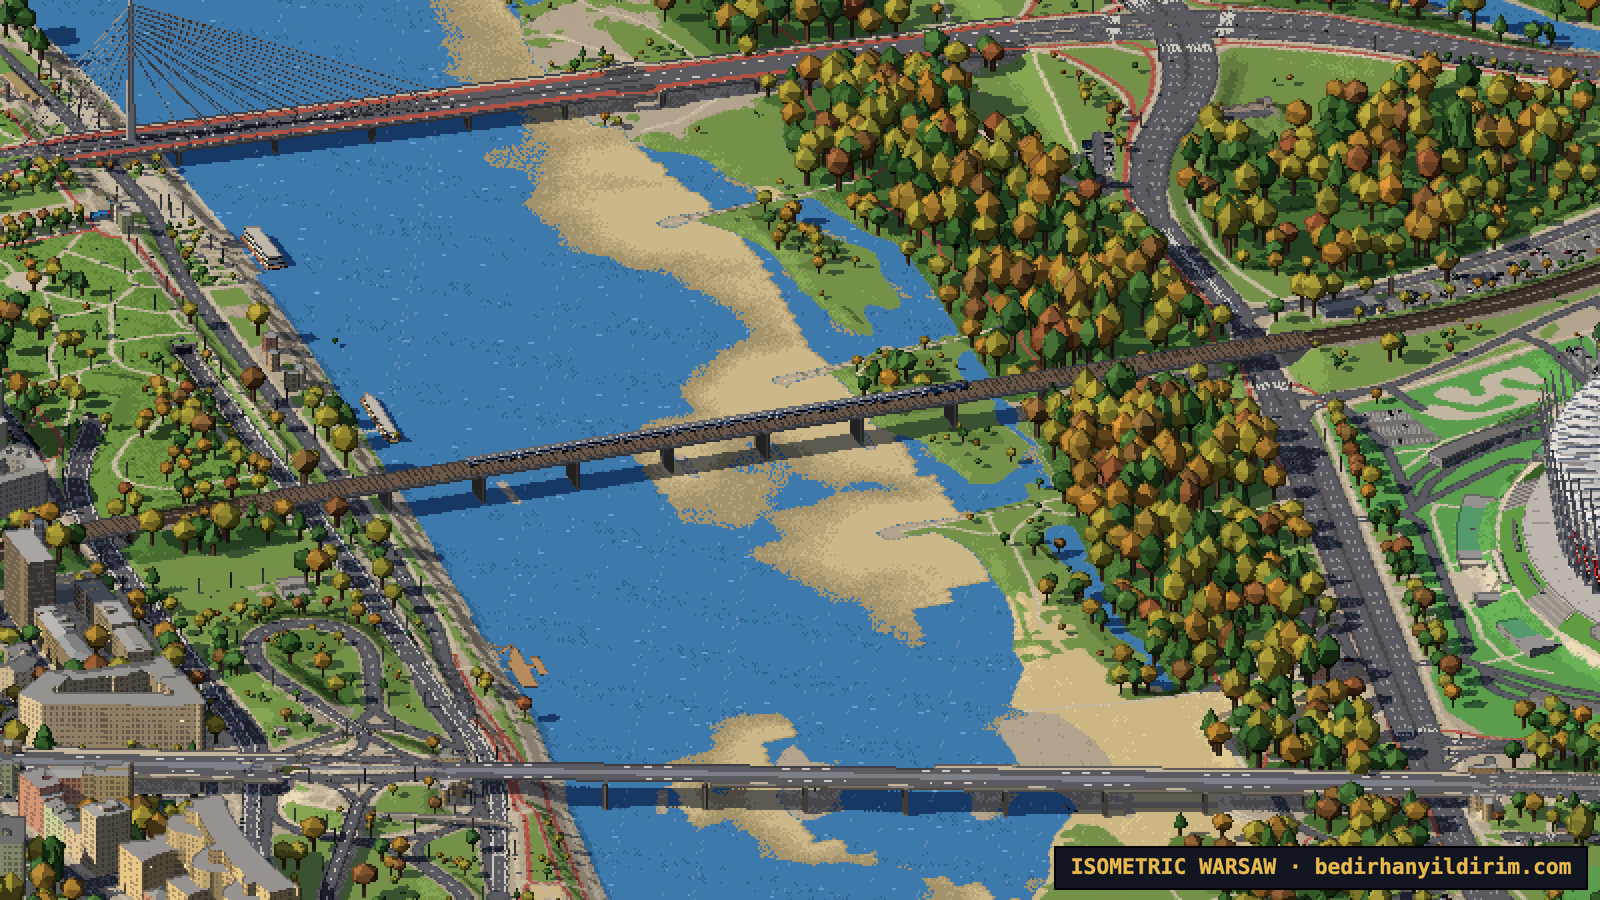
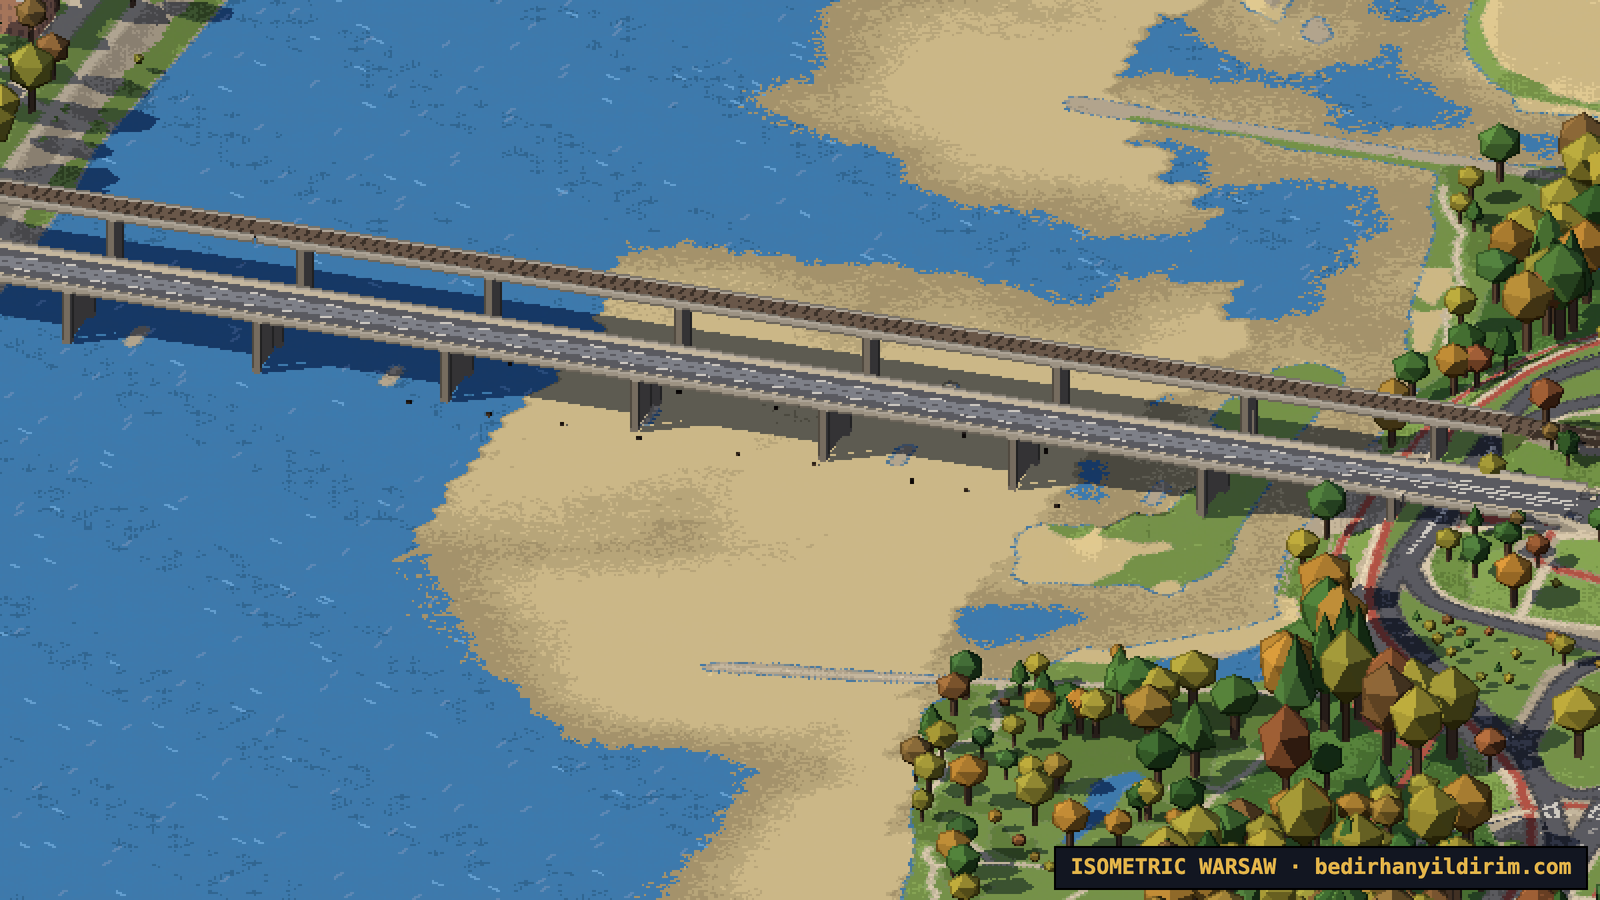
The bridges were the hardest part. The terrain data is “bare earth”: under a viaduct it contains the street below, not the bridge. So at first every long bridge sagged into the ground. We ended up writing a small bridge solver: decks span between their ends, keep at least 5 m above roads, 6.5 m above railways and 7.5 m above the river, and never sag. An automatic scan for broken bridges went from about 280 problems to 16.
Landmarks, built by hand (well, by agents)
Ordinary buildings come from data. But some places deserve more. For about 240 of them, agents built custom models from photos on Wikimedia Commons. Every one of them can be clicked for a short card with its history, height, year and architect.
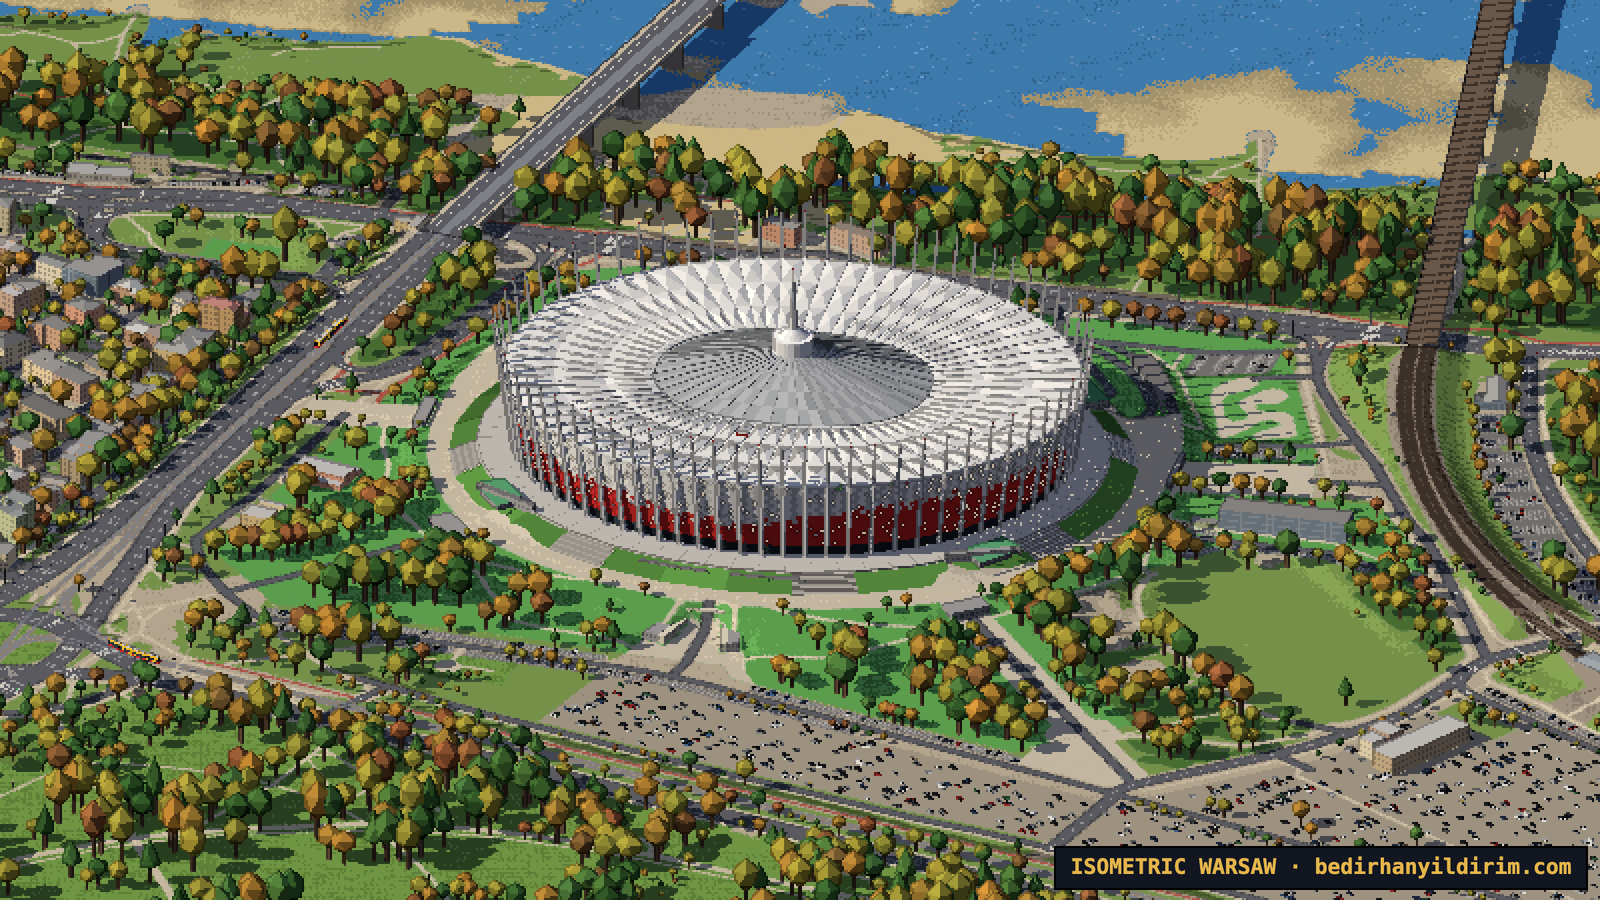
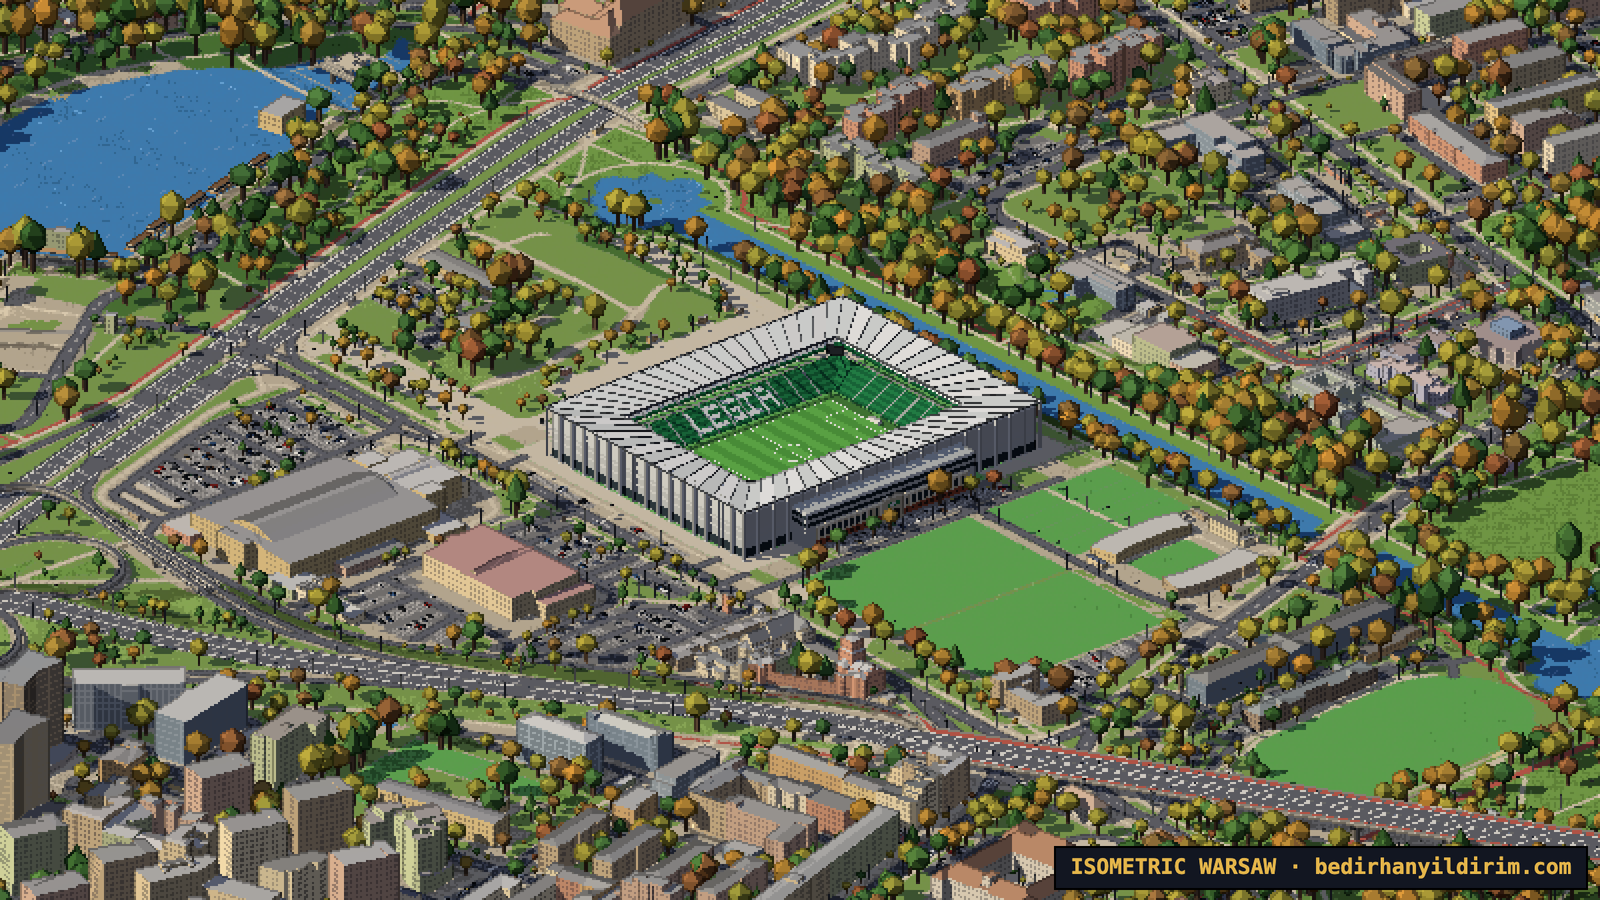
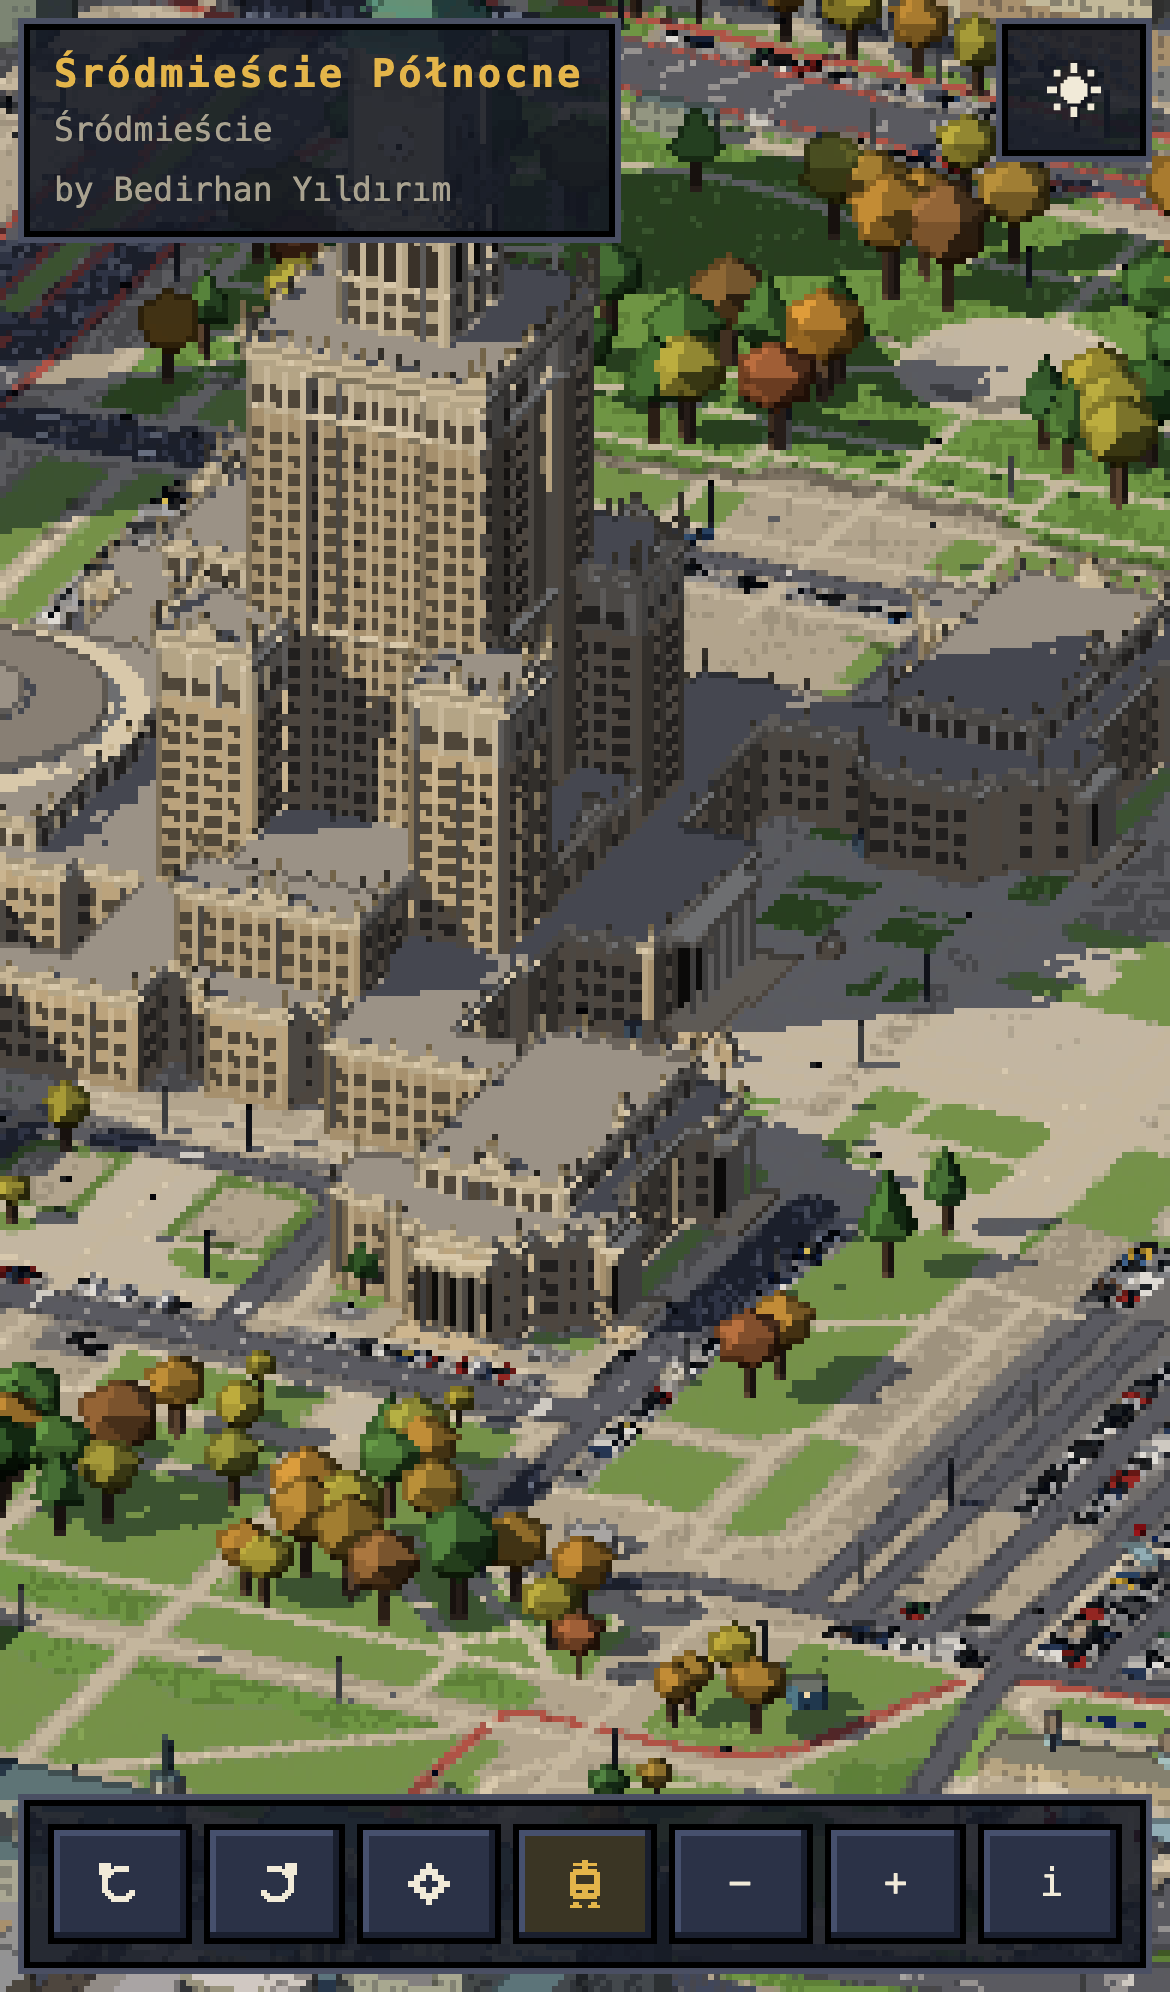
The Palace of Culture got its pinnacles, the four clock faces and the gilded spire. Both stadiums are there: PGE Narodowy with its red and white woven façade and the needle in the middle of the roof, and Legia’s stadium on Łazienkowska with the old 1930 grandstand façade kept on the street side. At night their floodlights and façades light up.
Chopin Airport and the sky above the city
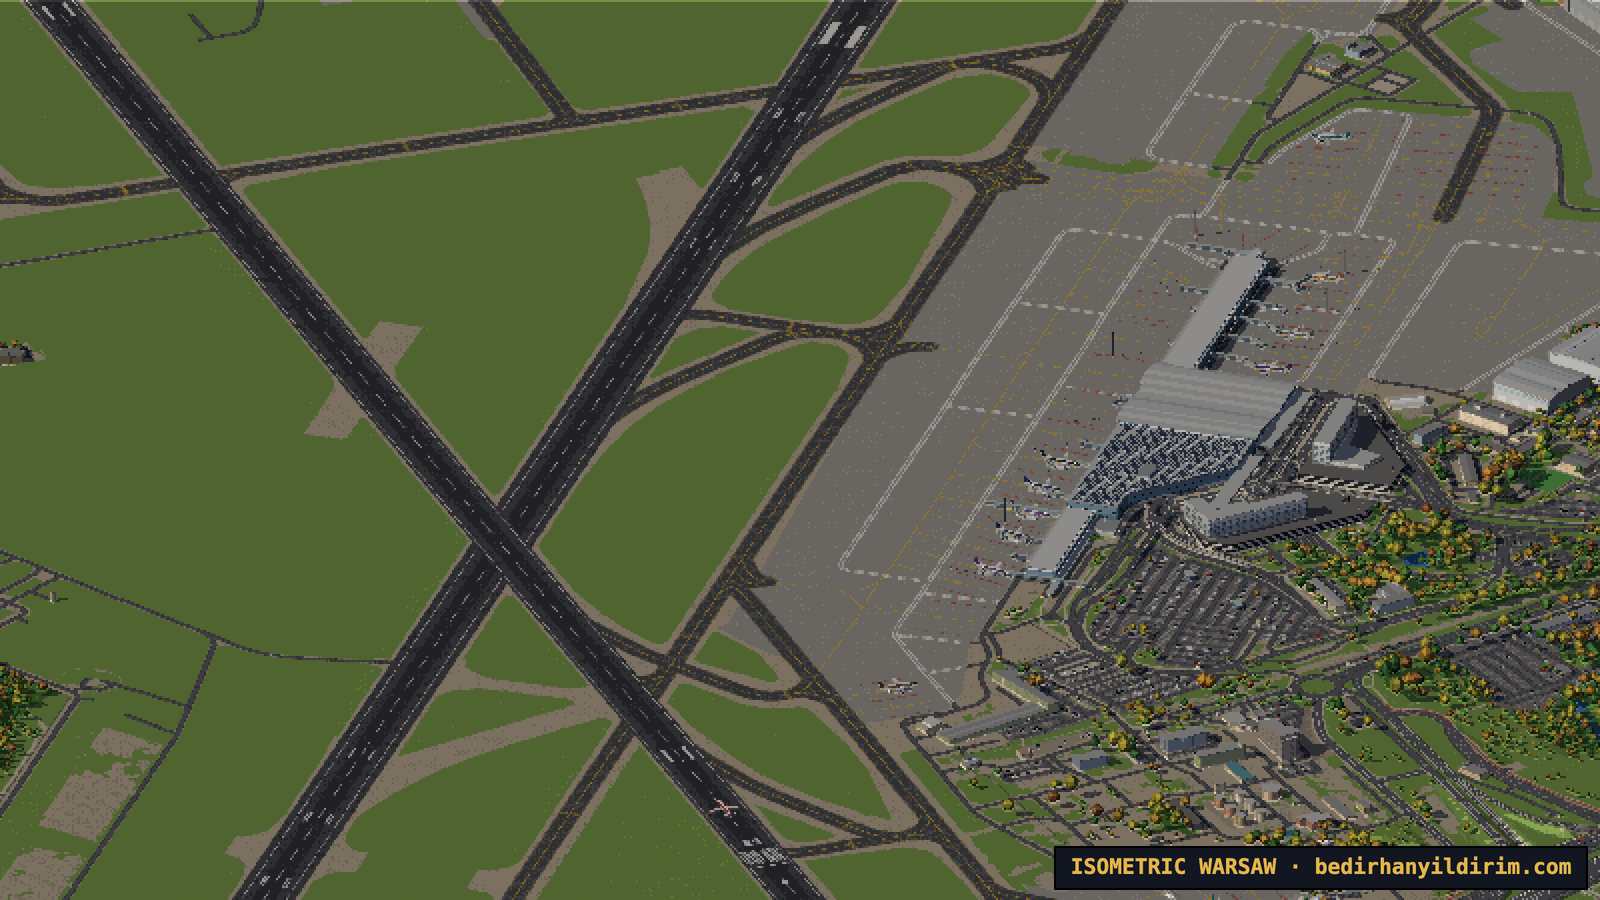
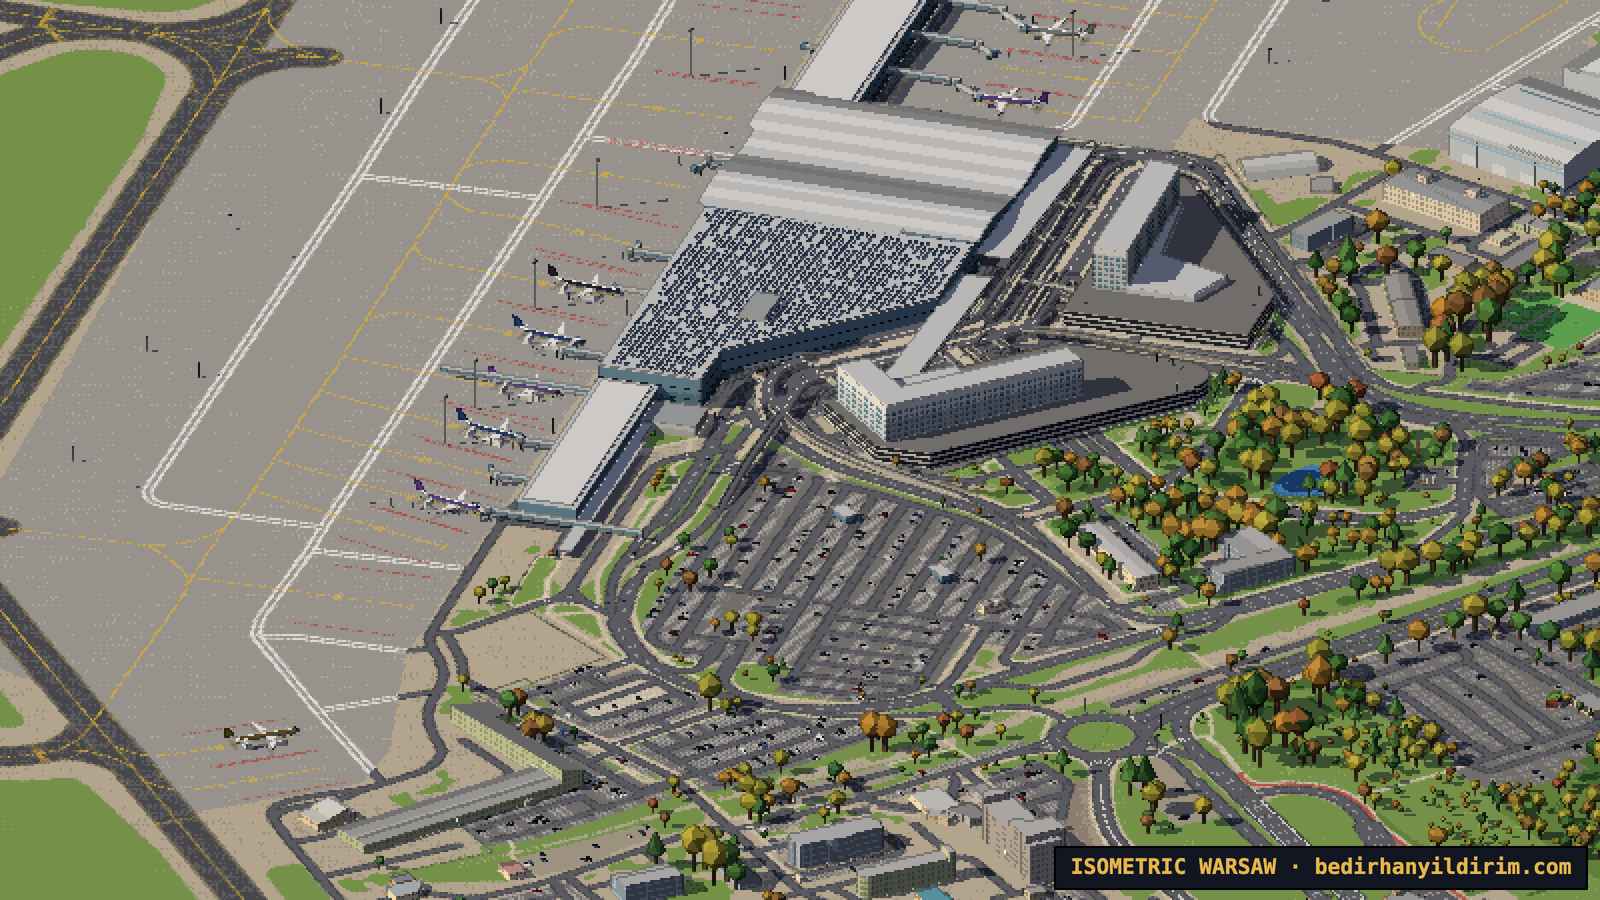
Lotnisko Chopina has its real runways, taxiways and stands from OpenStreetMap, the wavy roof of Terminal A, the jet bridges and the control tower. Around 370 flights a day land and take off, about one every two minutes at the busiest hours. The runway in use is picked by the “wind” of the day, so you will see planes coming in low over Ursynów or climbing out over Włochy, even when you are looking at another part of the city. At night only their navigation lights and strobes are visible.
The small airfield at Babice in Bemowo is there too, with small planes flying circuits, gliders towed into the air on fine days and the air ambulance helicopter.
Old forts and old factories
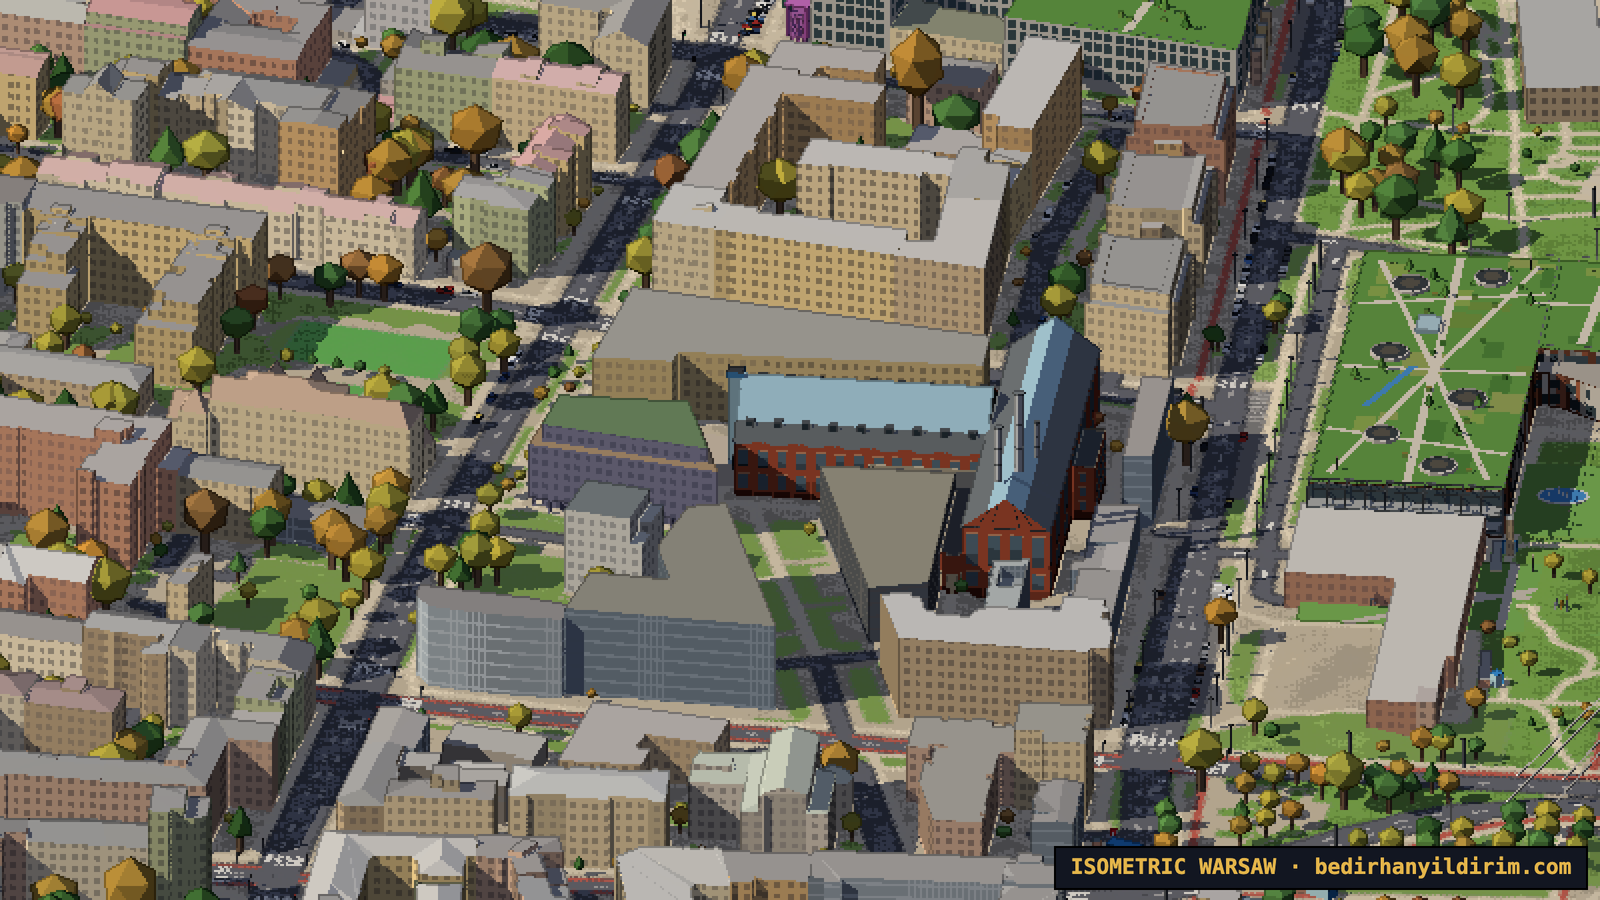
Warsaw was a fortress city in the 19th century, and most of the ring of forts still exists. The Citadel is modelled with its gates, bastions and the new Museum of Polish History. Nineteen forts around the city, like Fort Bema, Fort Mokotów and Fort Czerniaków, show their ramparts and moats, which were already in the terrain data, so we only had to add the grass, the brick casemates and the trees.
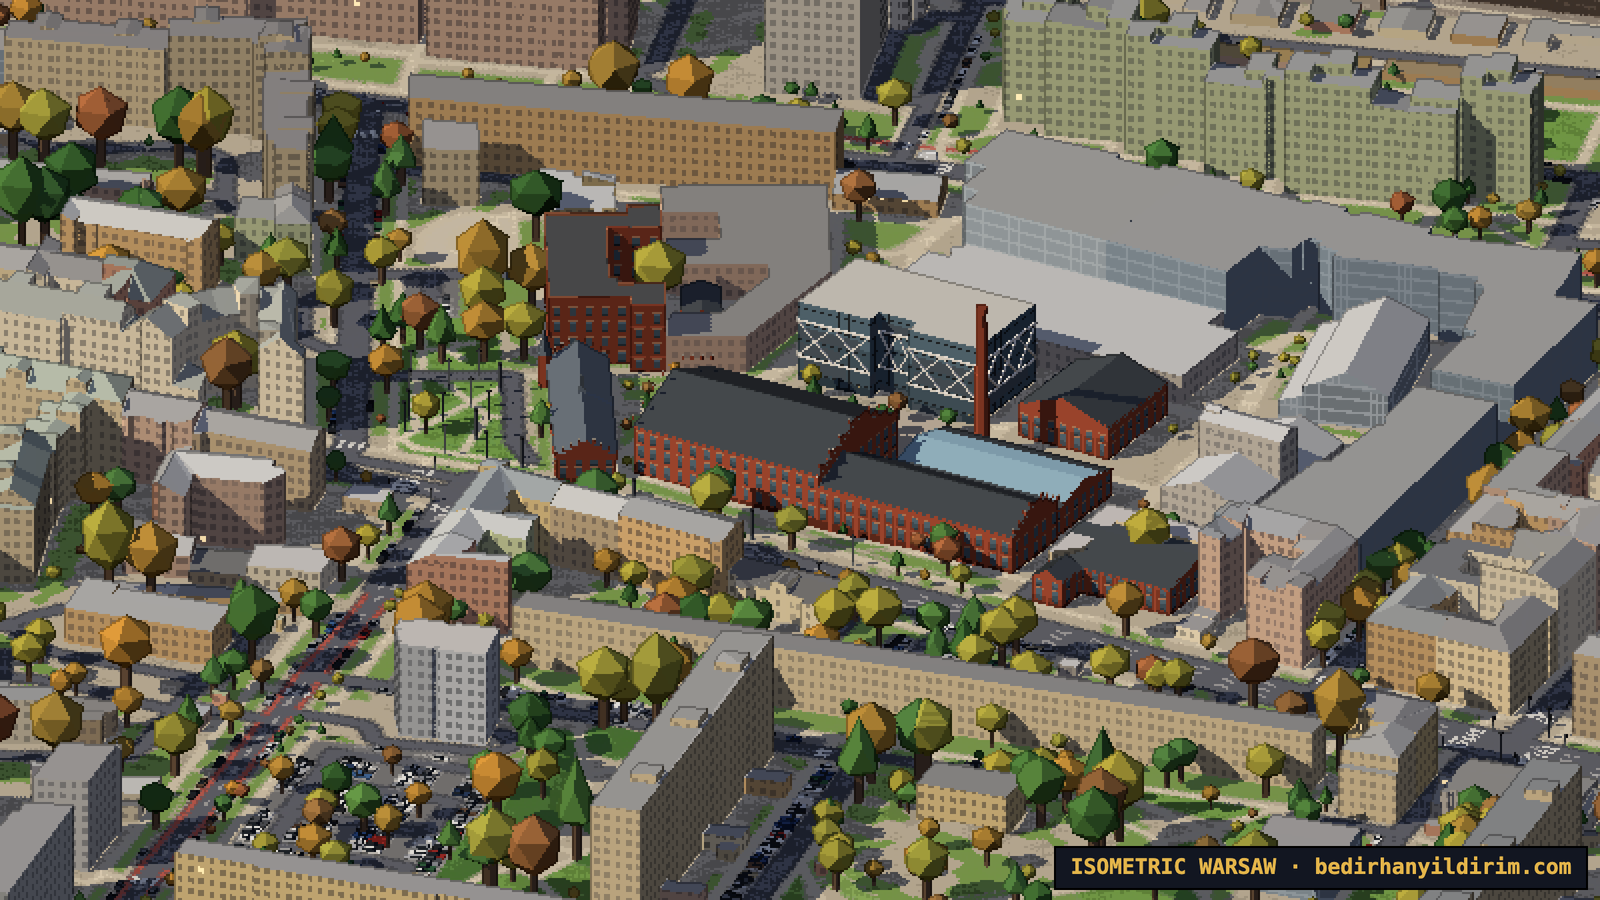
Then there are the old factories that became the city’s favourite places to eat and meet: Elektrownia Powiśle, Fabryka Norblina, Koneser with its brick chimney, Browary Warszawskie, Hala Koszyki and the round gasholders in Wola.
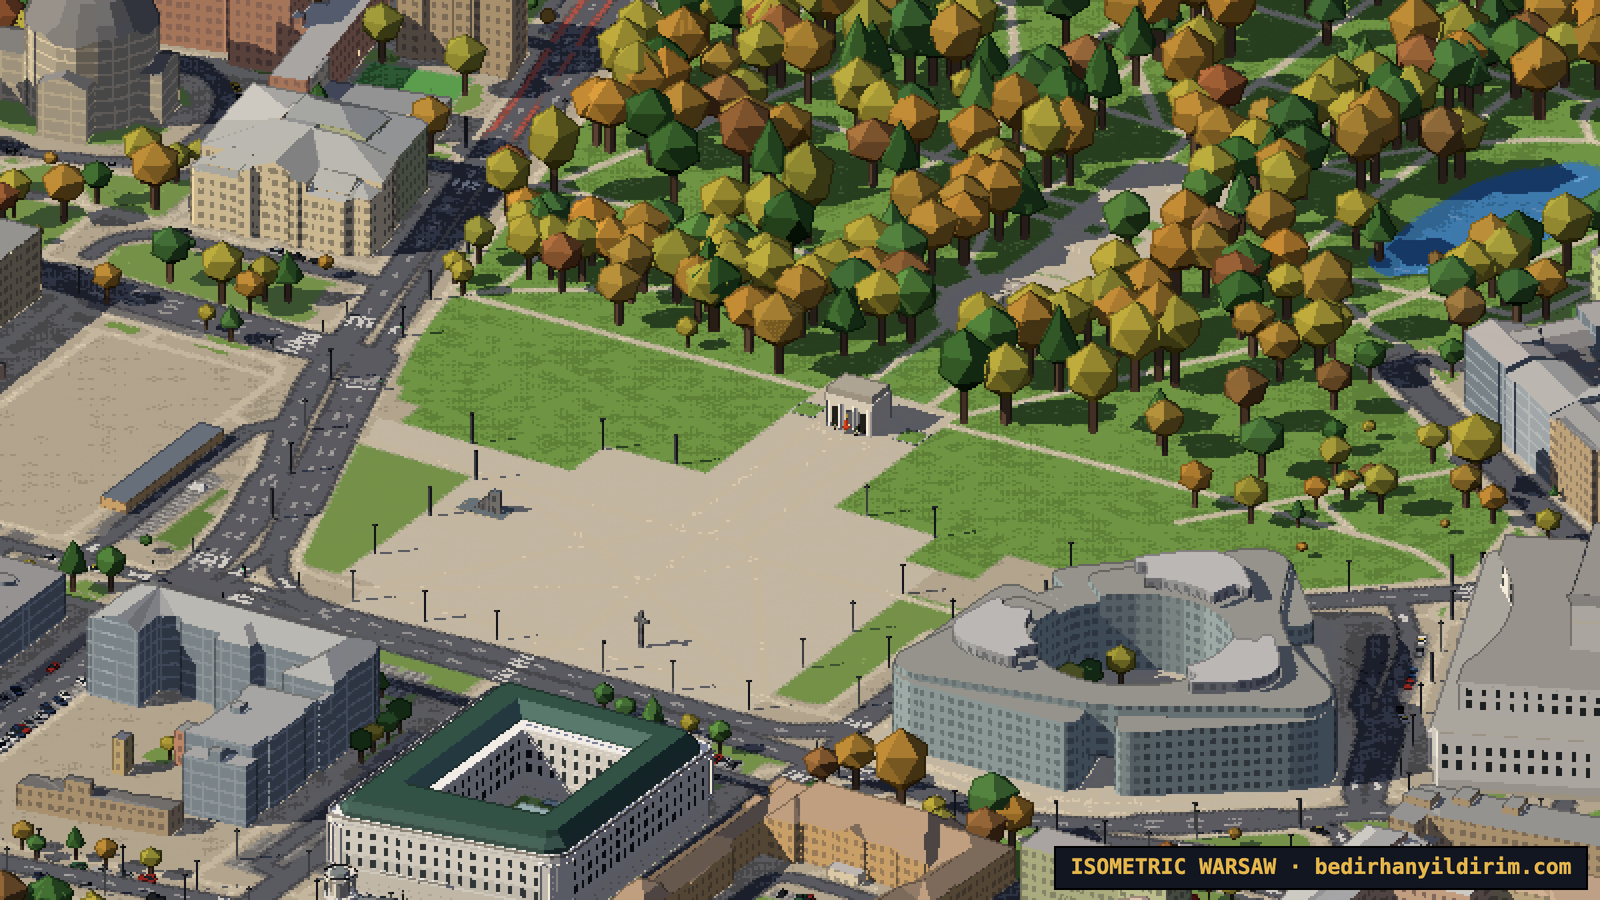
My favourite small detail is on Piłsudski Square: the Tomb of the Unknown Soldier with its eternal flame, which flickers in the map, and two honour guards standing next to it.
Parks, ducks and peacocks
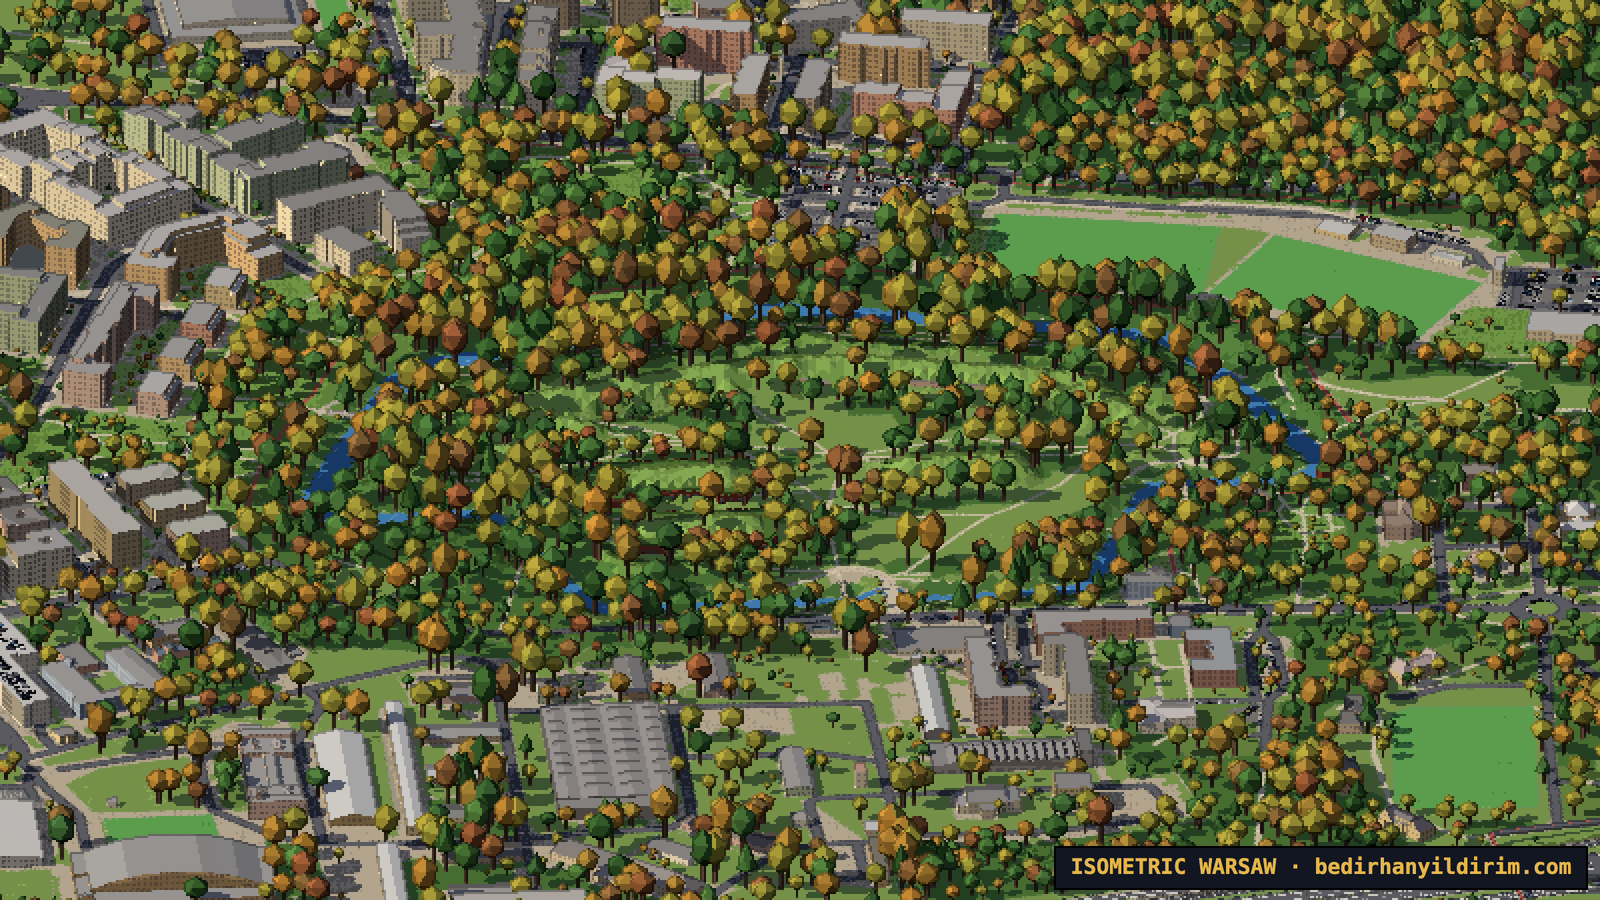
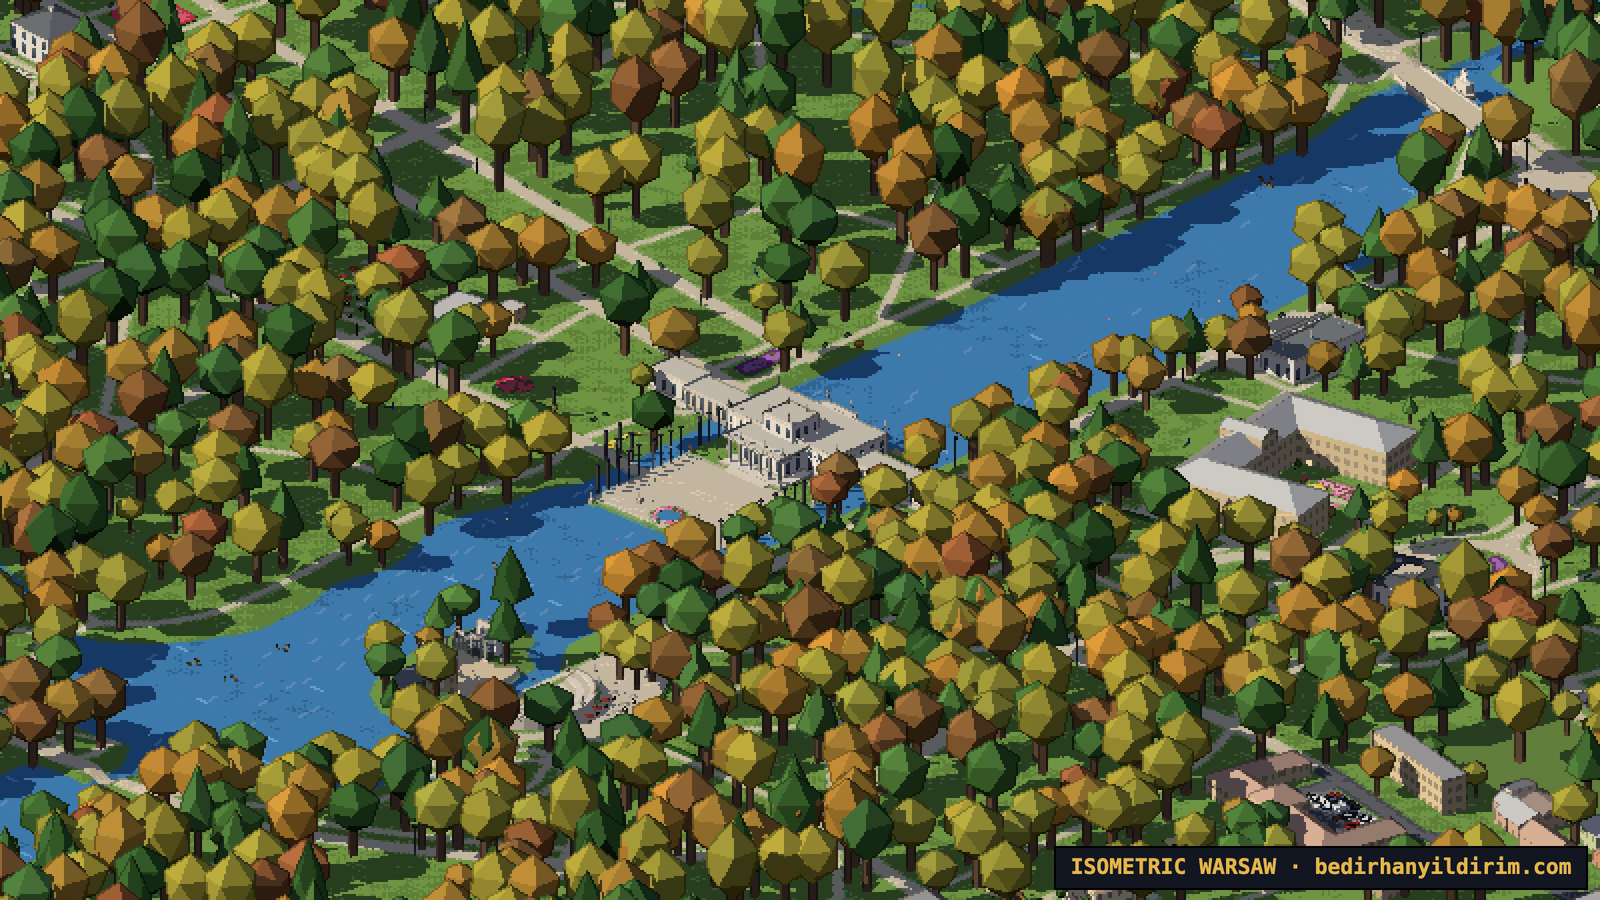
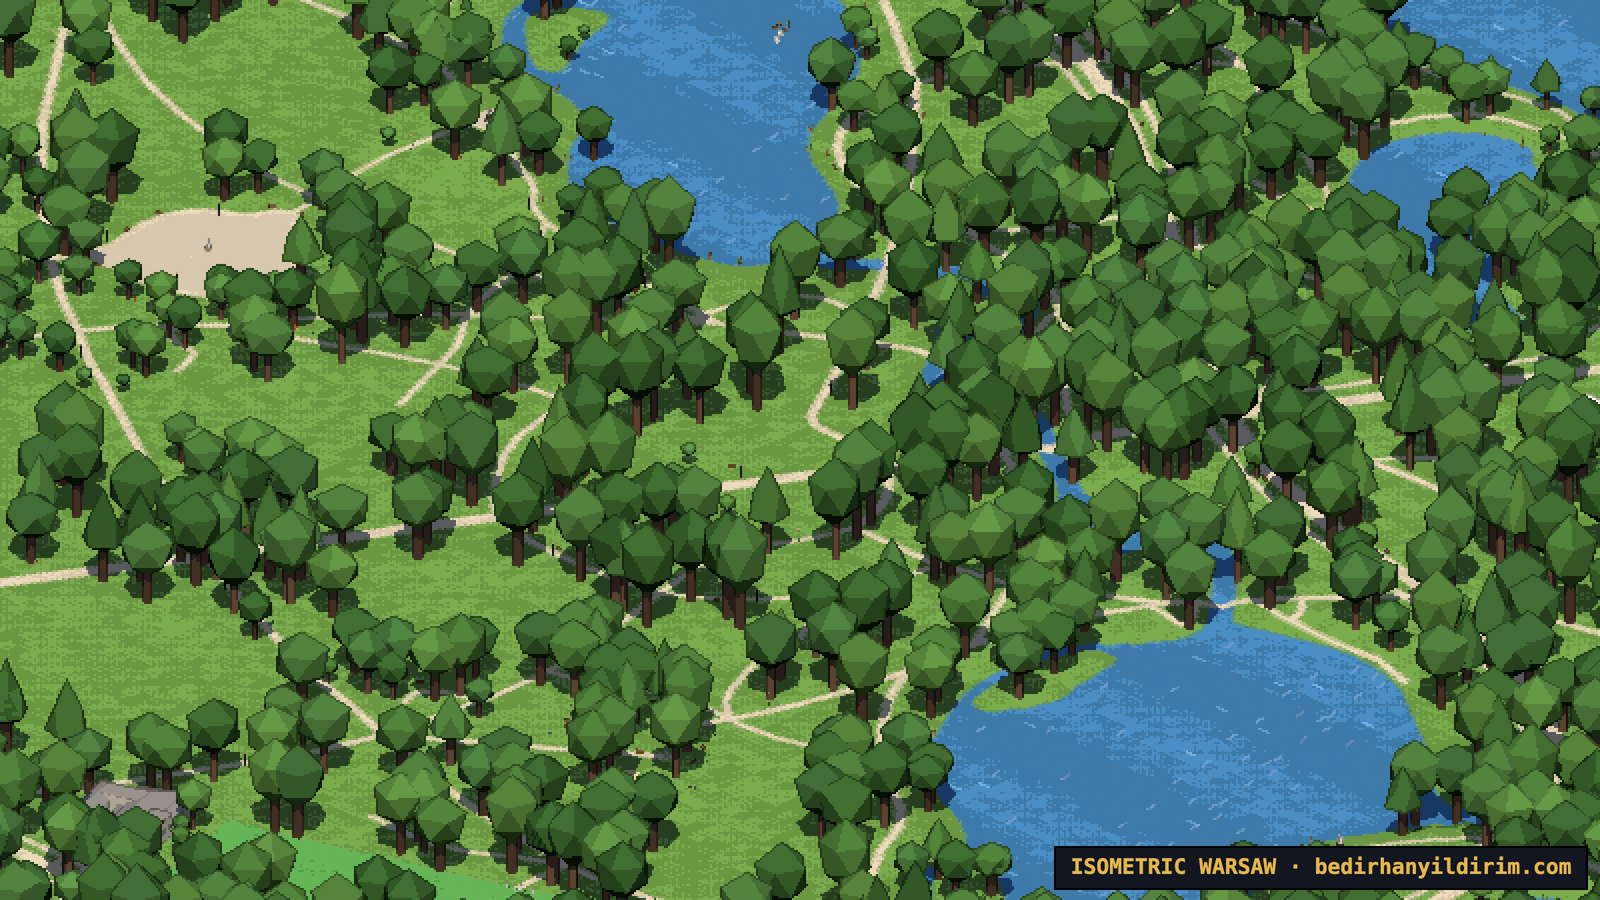
Warsaw is a very green city, and the parks got their own models. In Łazienki there is the Palace on the Isle with its colonnades and statues, the amphitheatre on the island, the Chopin Monument and the Orangeries. Peacocks walk on the lawns near the palace (some of them showing their tail), carp swim in the pond by the palace, and red squirrels run between the trees.
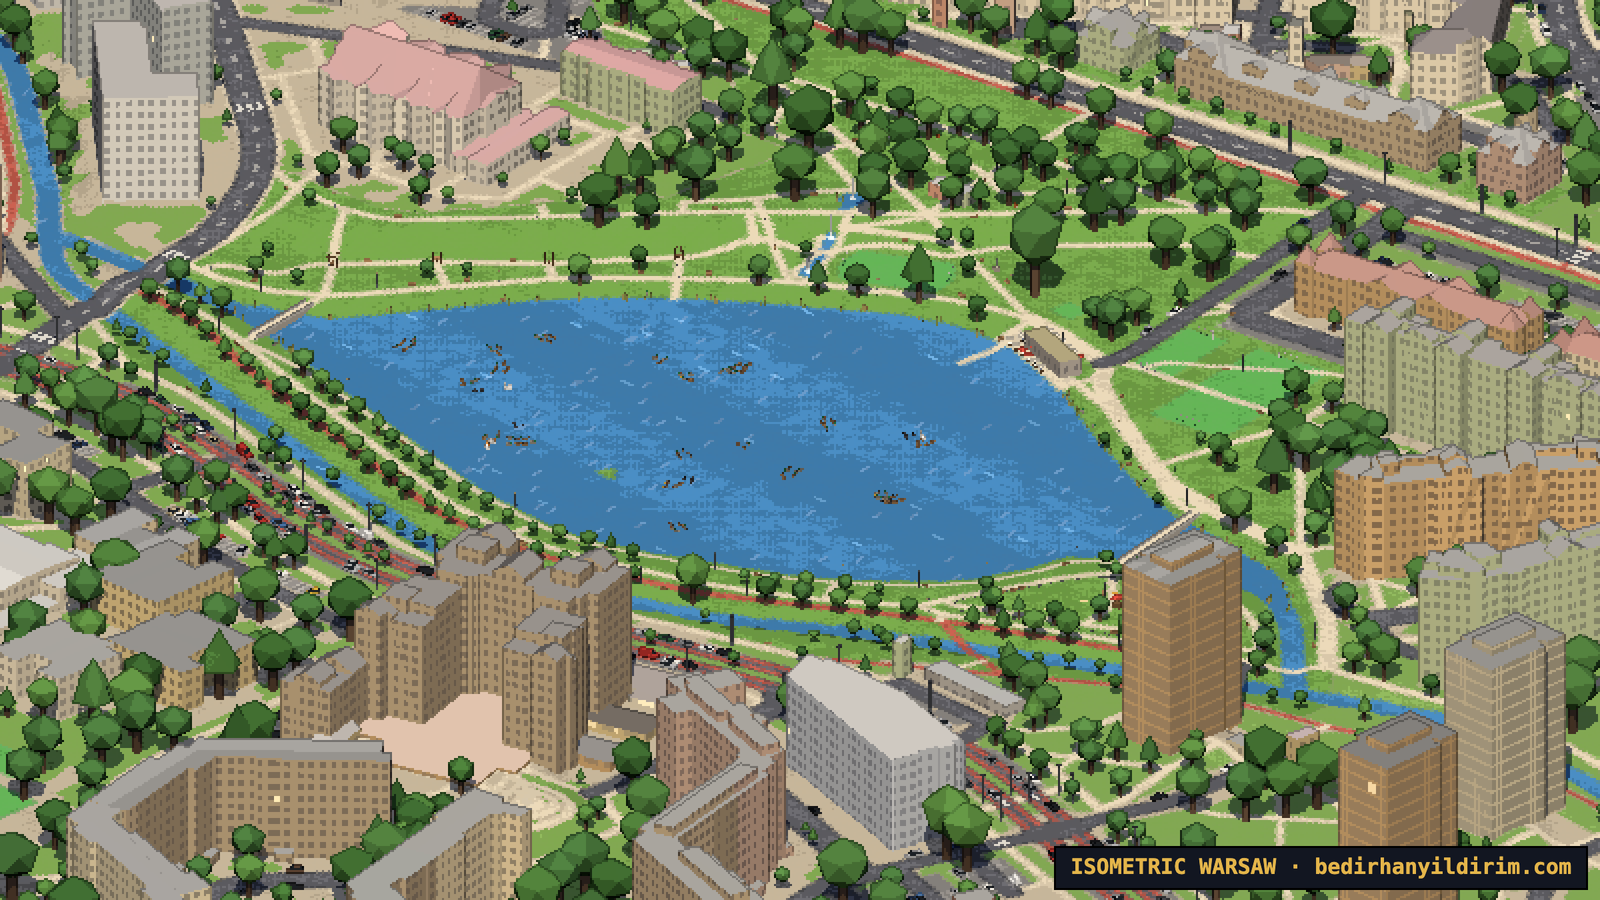
Skaryszewski Park in Praga has its lake with swans and ducks, the rose garden and the art deco sculptures. Pole Mokotowskie, Morskie Oko and the parks in Mokotów each have their own character. And the lake in Park nad Balatonem in Gocław has the biggest flock of all, more than a hundred ducks, plus swans and coots.
The animals follow the clock and the seasons too. Peacocks stay in their aviary in winter. When the ponds freeze, fewer ducks are out and more of them rest on the bank.
Trams and trains
Trams were non-negotiable. They are Warsaw. All 26 lines run on their real routes, with the frequencies from the ZTM timetable for each hour of the day, weekdays and weekends. The yellow and red Pesa Jazz and Swing trams bend at their joints in curves, and the old Konstal 105Na sets still run on some lines. Trams stop at the stops, slow down in curves, wait for each other and turn around in the loops at the end of the line. They cross Most Poniatowskiego at deck height and disappear into the tunnel under Plac Zamkowy. At night their windows and headlights are on.
Trains run on the real timetables too: SKM, Koleje Mazowieckie, WKD and Intercity, more than 1,600 trips on a weekday. They stop at the right platform, wait longer at Centralna, Wschodnia and Zachodnia, and slide into the cross-city tunnel. There are freight trains as well, mostly at night.
I decided against moving cars and buses. They would get mixed up with the trams and make the map too busy. Instead there are about 600,000 parked cars, and they follow the time of day: housing estates are full at night, offices are full on weekdays, and shopping centre car parks are almost empty on Sundays, because shops in Poland are closed.
Roads, cycle paths and street lamps
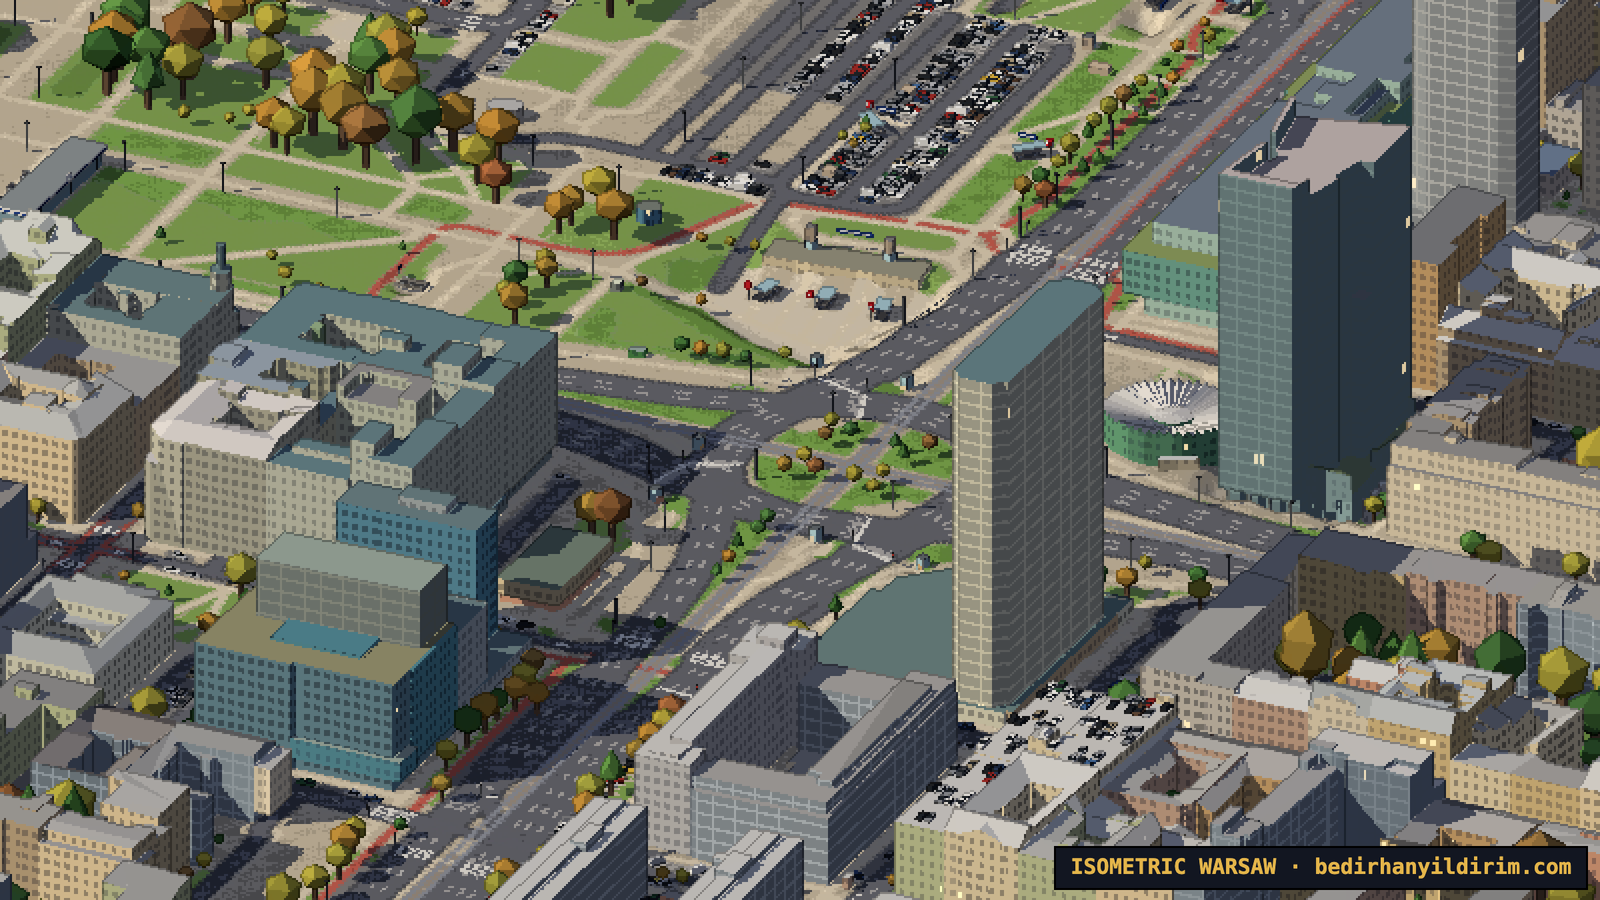
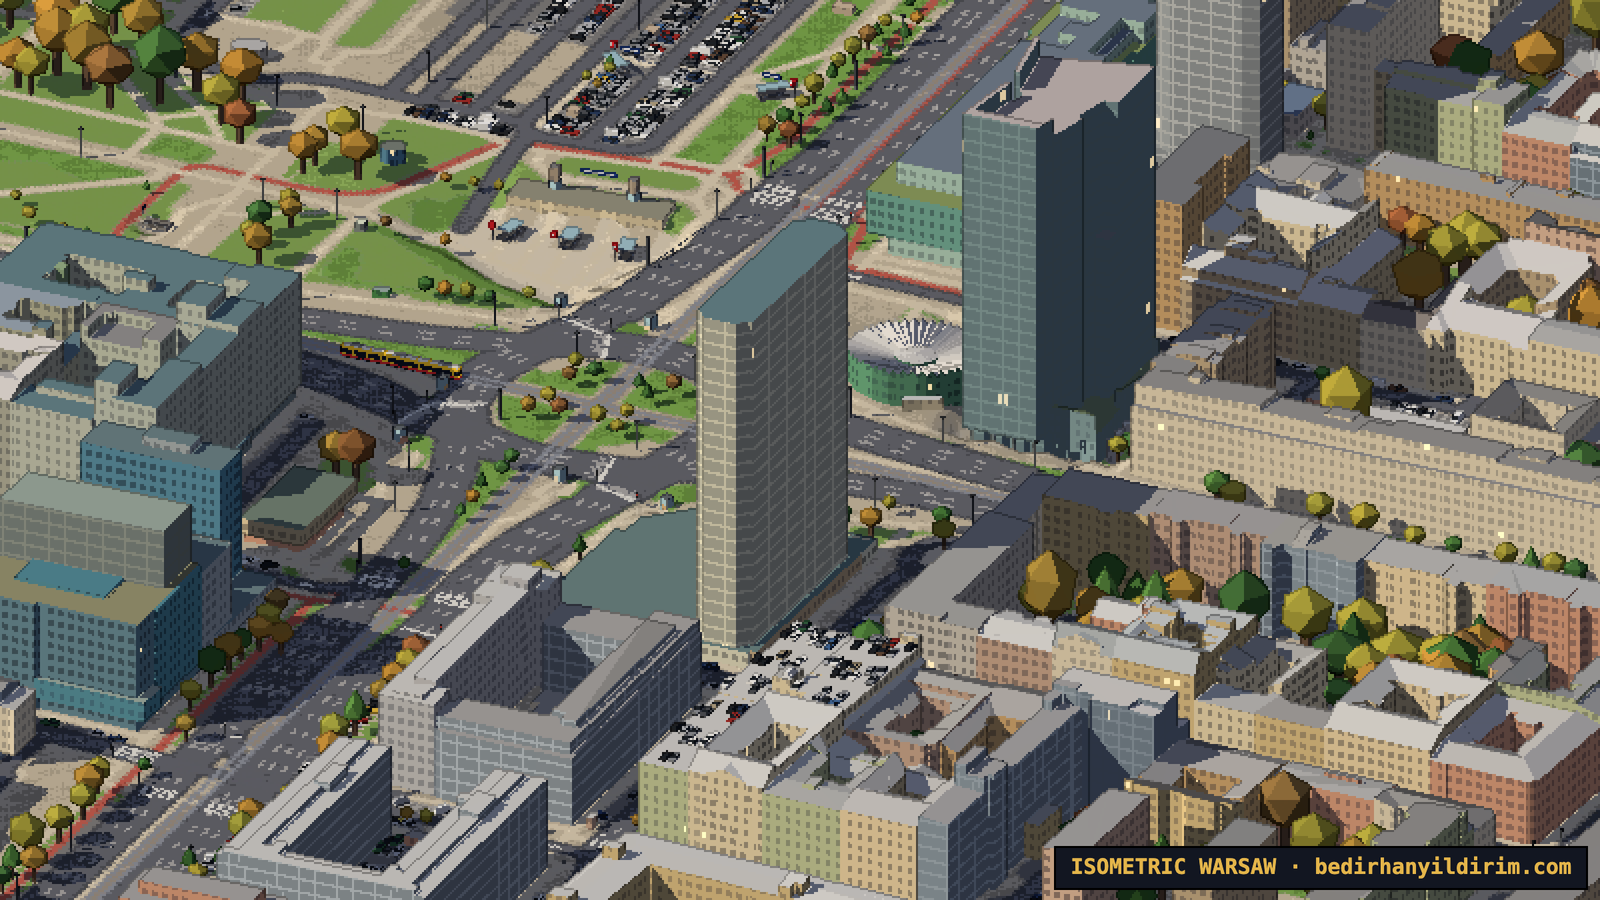
In the first versions the roads were plain grey bands. Now they are drawn from the OpenStreetMap tags, without guessing: the width comes from the number of lanes, dual carriageways get a median, and 22,300 roads get their centre lines, lane dividers and edge lines. There are 23,000 zebra crossings, stop lines at traffic lights, and turn arrows near the junctions.
Warsaw has a lot of cycle paths, and they are drawn in the red asphalt they really have. Roads with painted cycle lanes get a red band on the side.
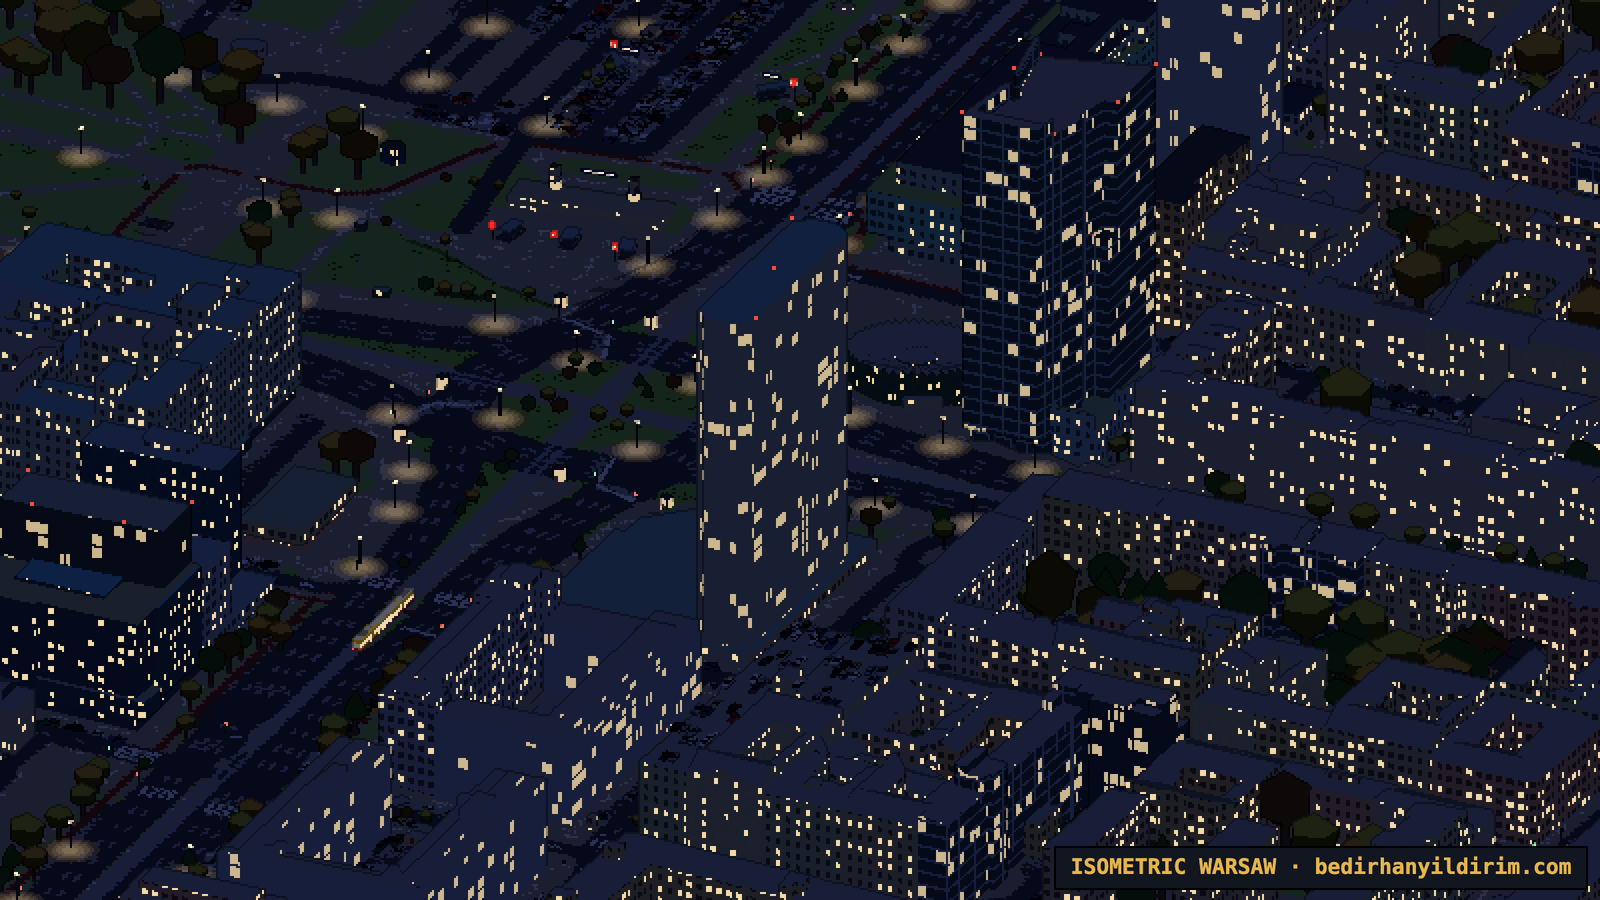
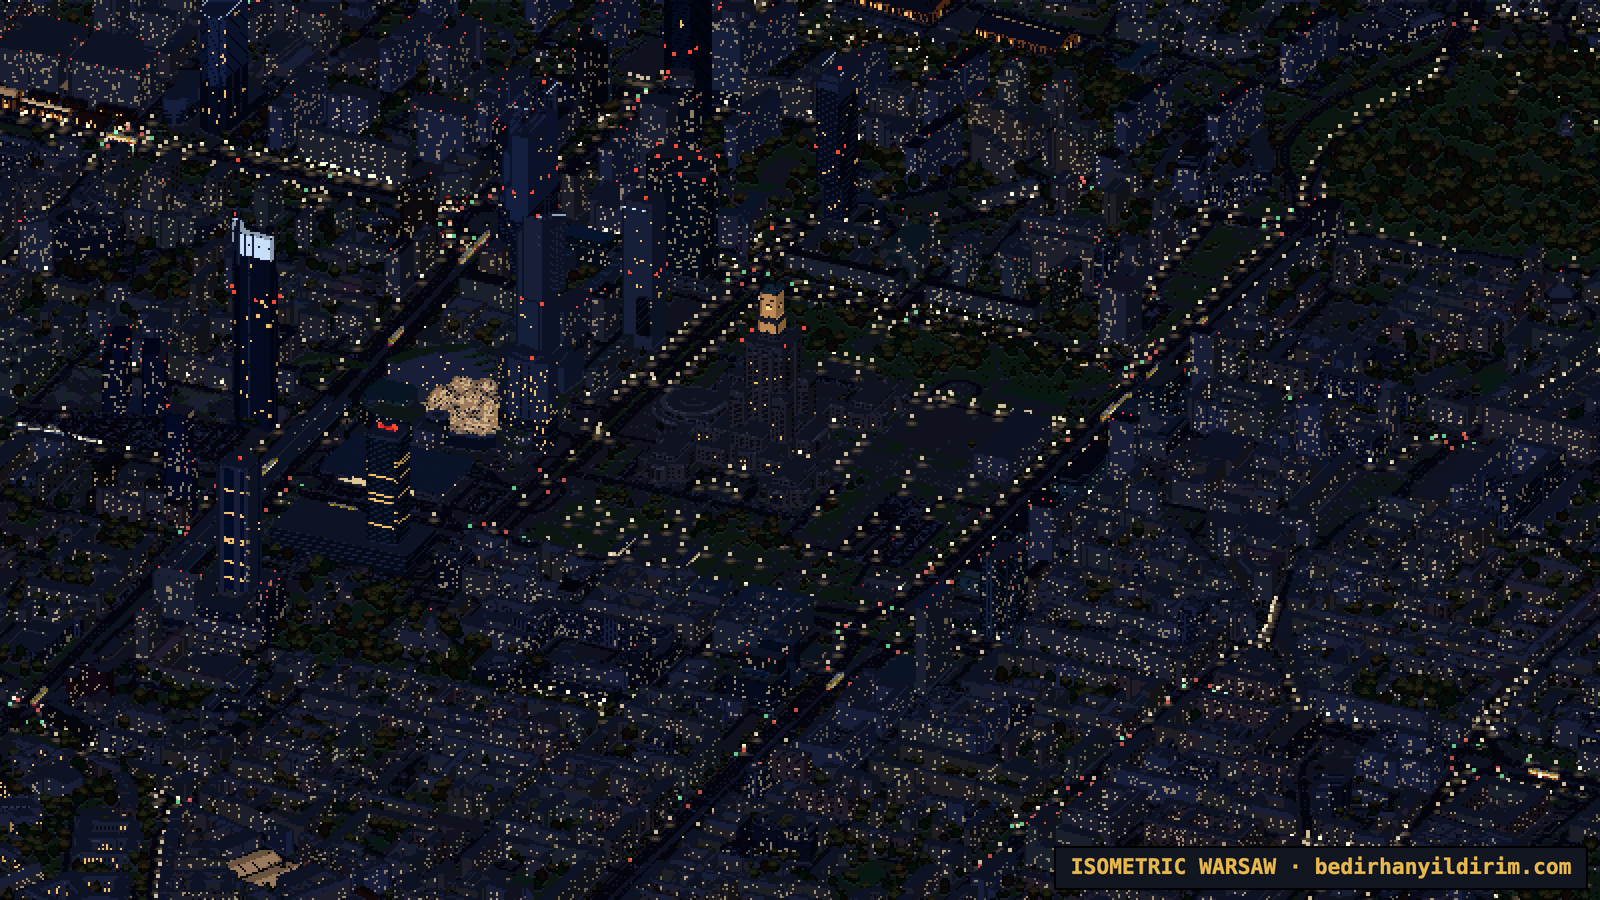
6,700 traffic lights stand at their stop lines, facing the traffic. Guard rails, concrete barriers and the noise barriers along the S2 and S8 expressways are built along their mapped lines. And at night the 46,873 street lamps light the roads with warm pools of light.
The Vistula rises and falls
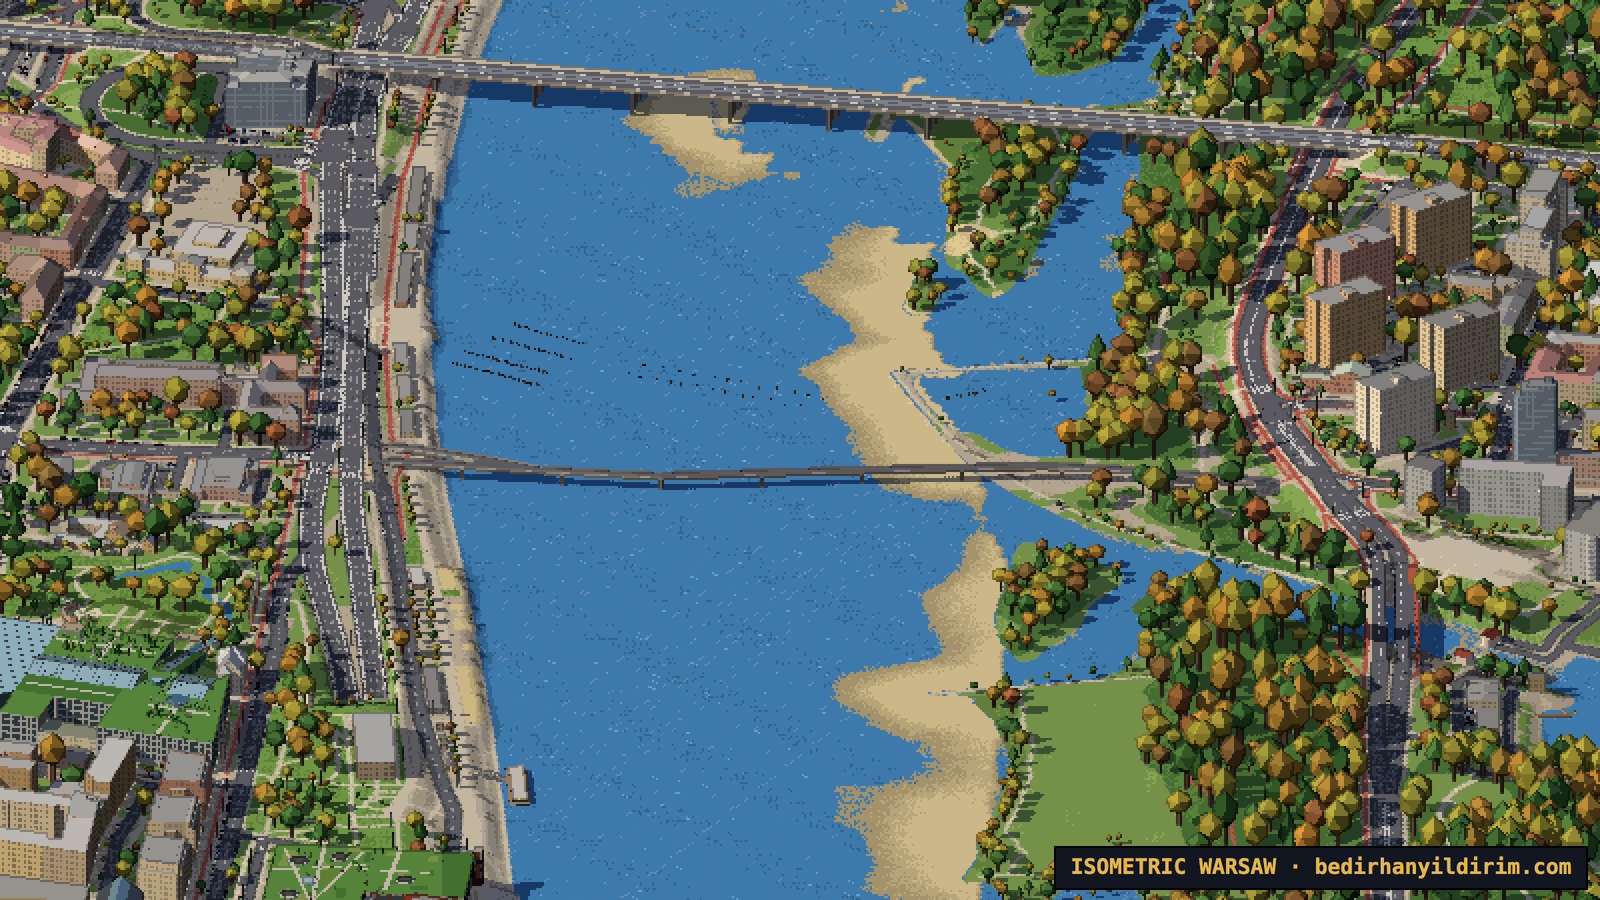
This is the part I am most proud of. The river is not just a blue shape: its level changes with the date. It follows the real monthly averages at the Warszawa-Bulwary gauge, high in March and April when the snow melts, low at the end of summer.
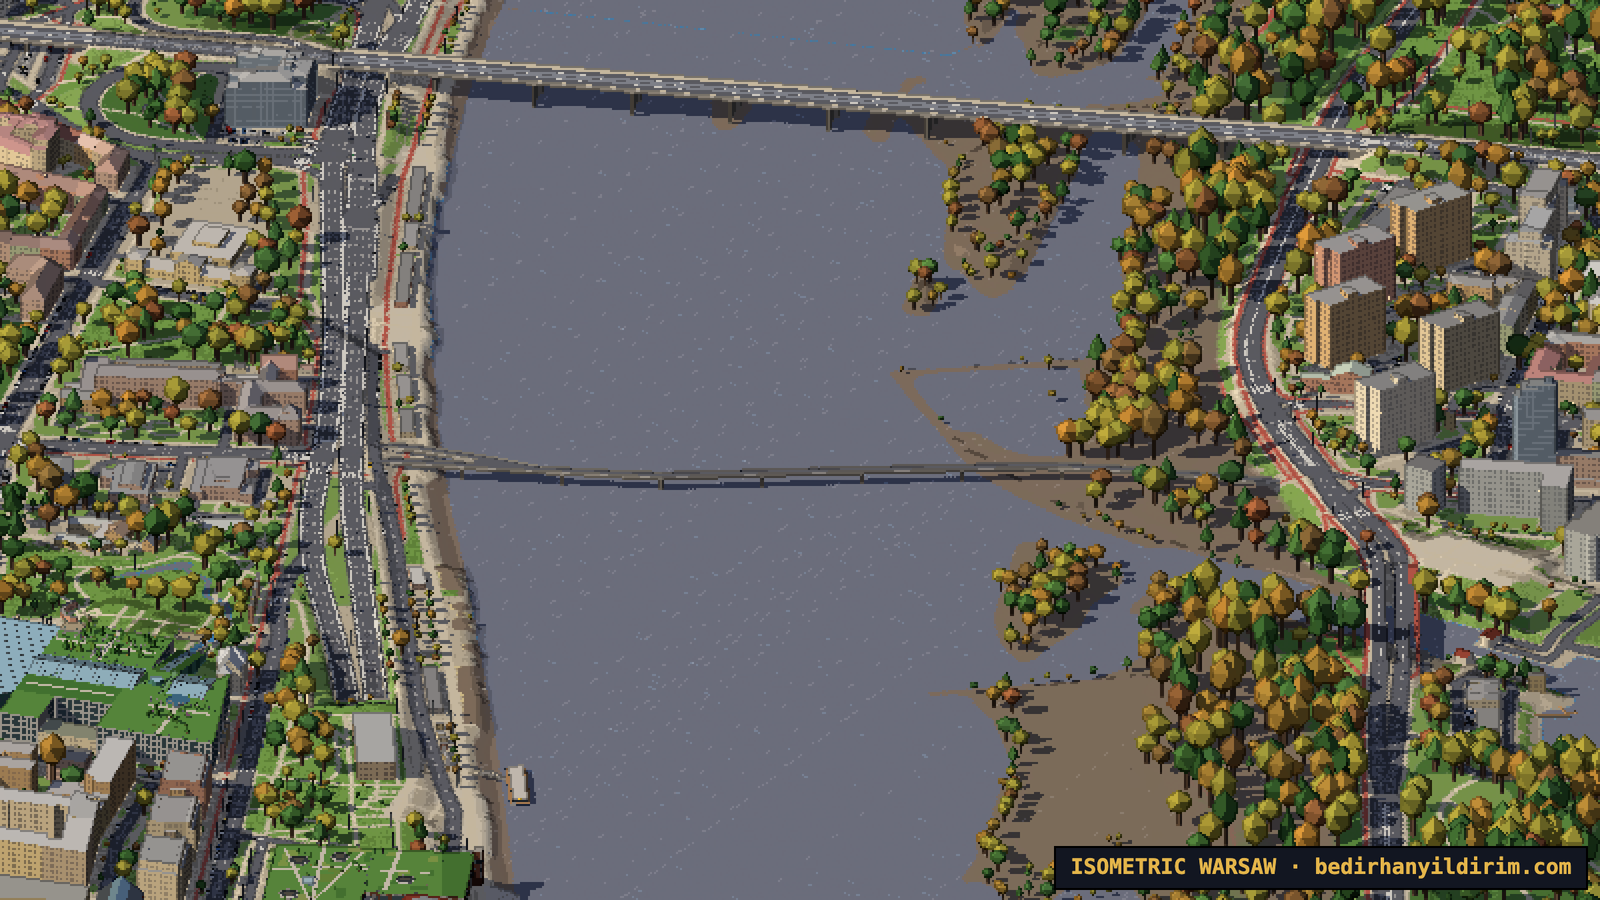
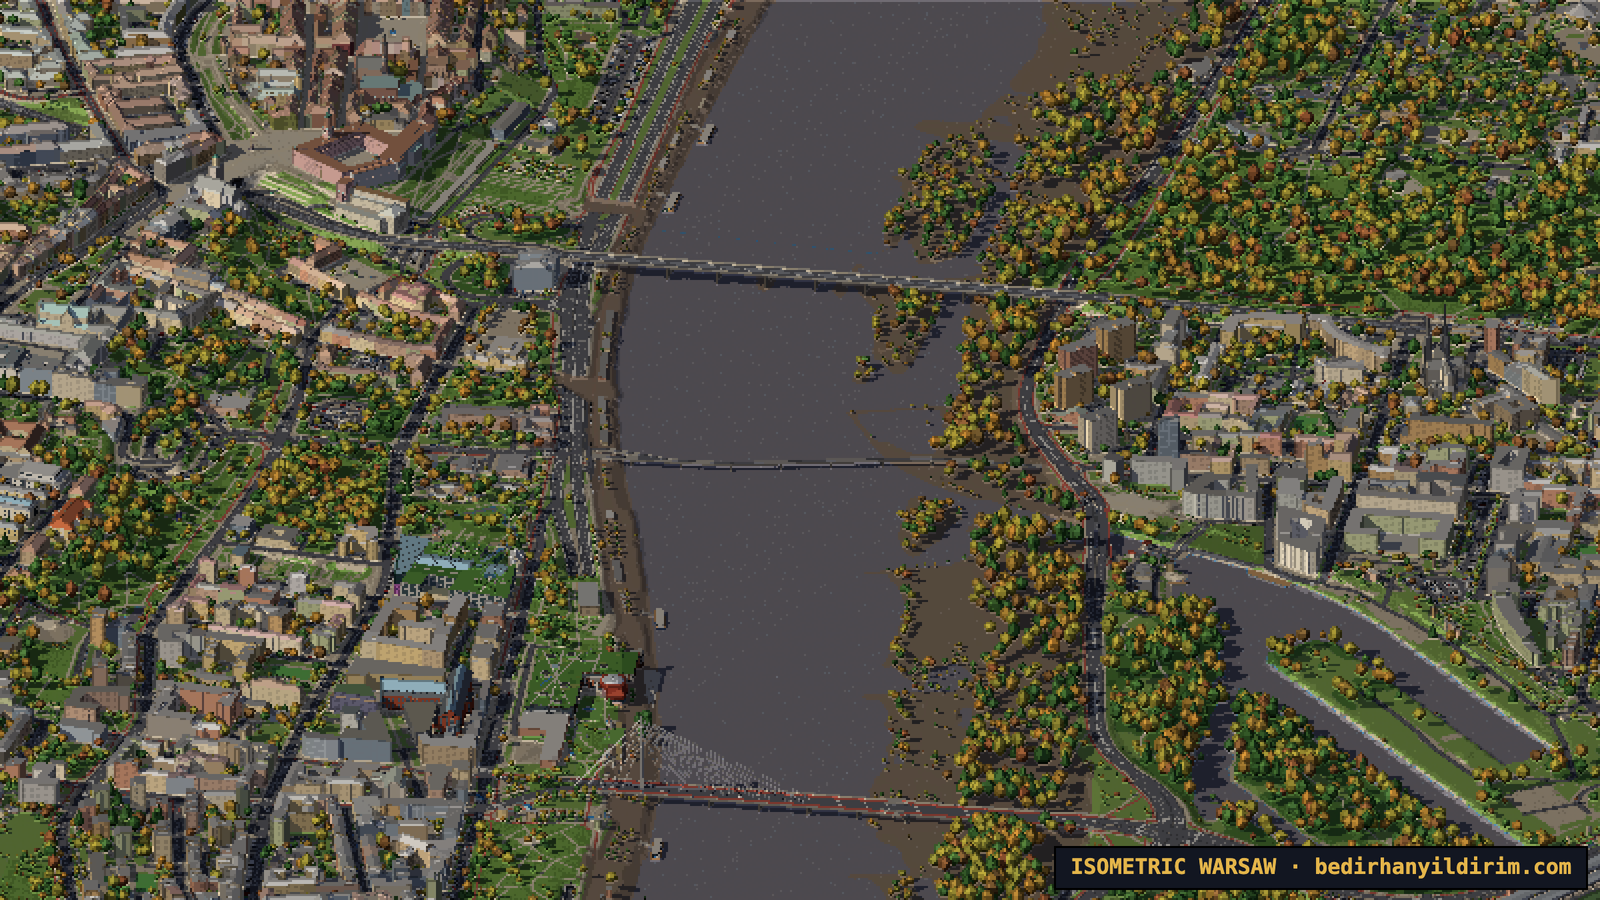
This autumn the Vistula is close to its record low, and that is what the map shows by default. Sandbars and wide beaches appear on the Praga side. You can also move a slider to set the level yourself, all the way up to a flood, when the beaches and the low boulevards disappear under brown water.
What the river hides
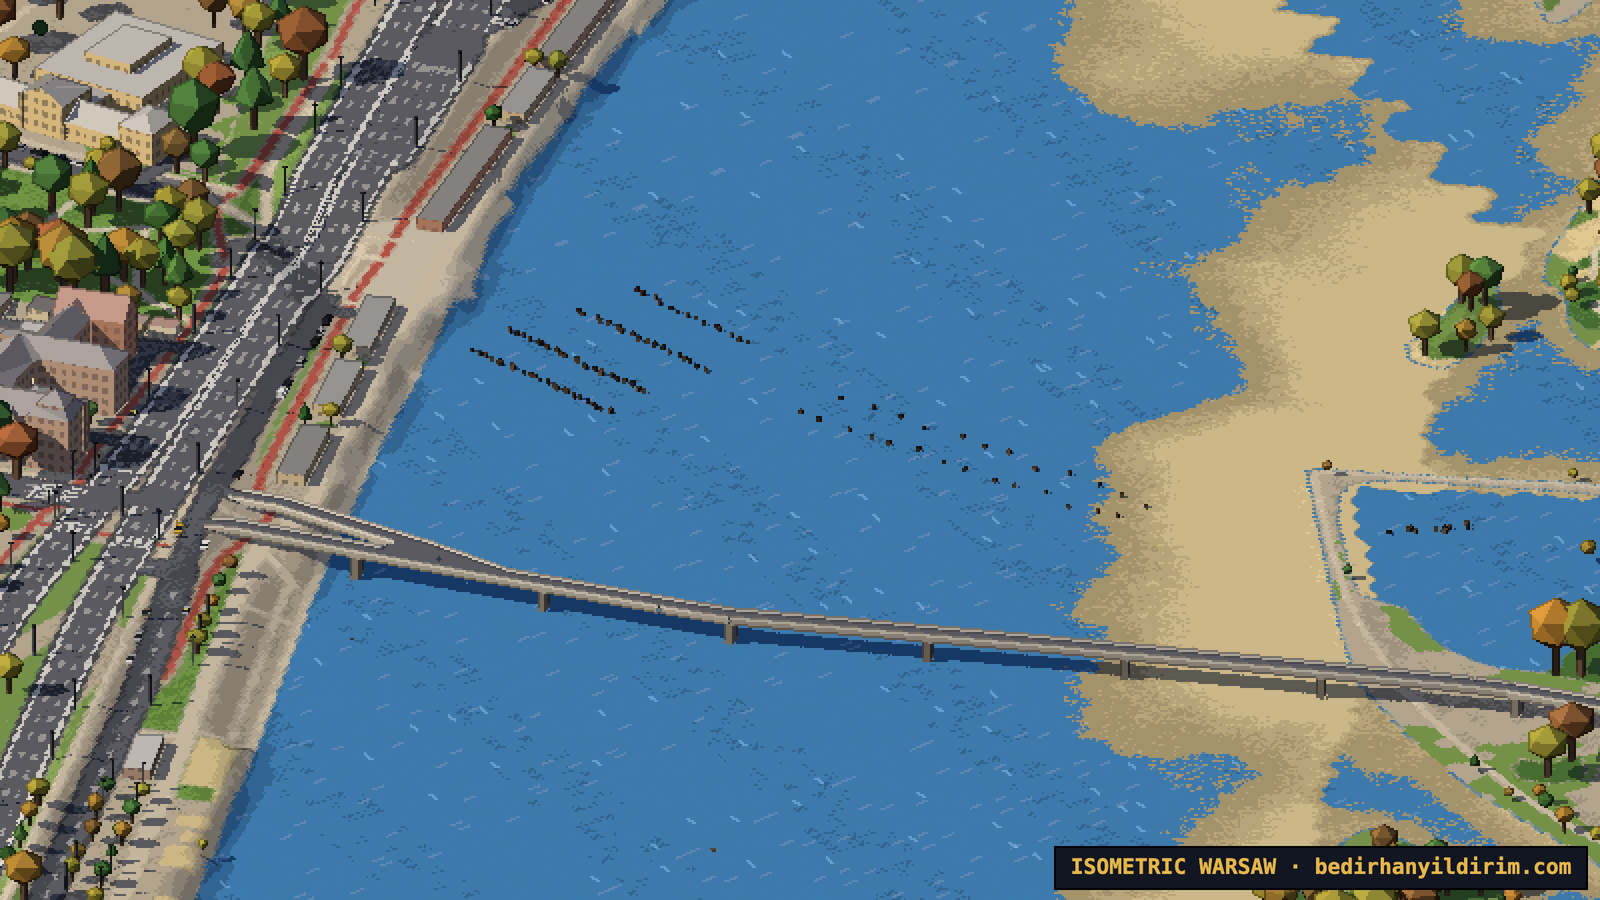
In 2025 the water was so low that the remains of old bridges came out of the river, and archaeologists counted hundreds of wooden piles. So we put them on the map. When the level drops below their height, the tops of the piles appear first, then more of them: near Bednarska, where some piles come from the 18th-century Most Ponińskiego, the piles of a temporary bridge from 1945, the 1945 railway bridge piles near Most Gdański, and a probable shipwreck near ulica Wilanowska. Each of them has an info card, and the ones whose position is only estimated say so.
Rowing clubs and boats
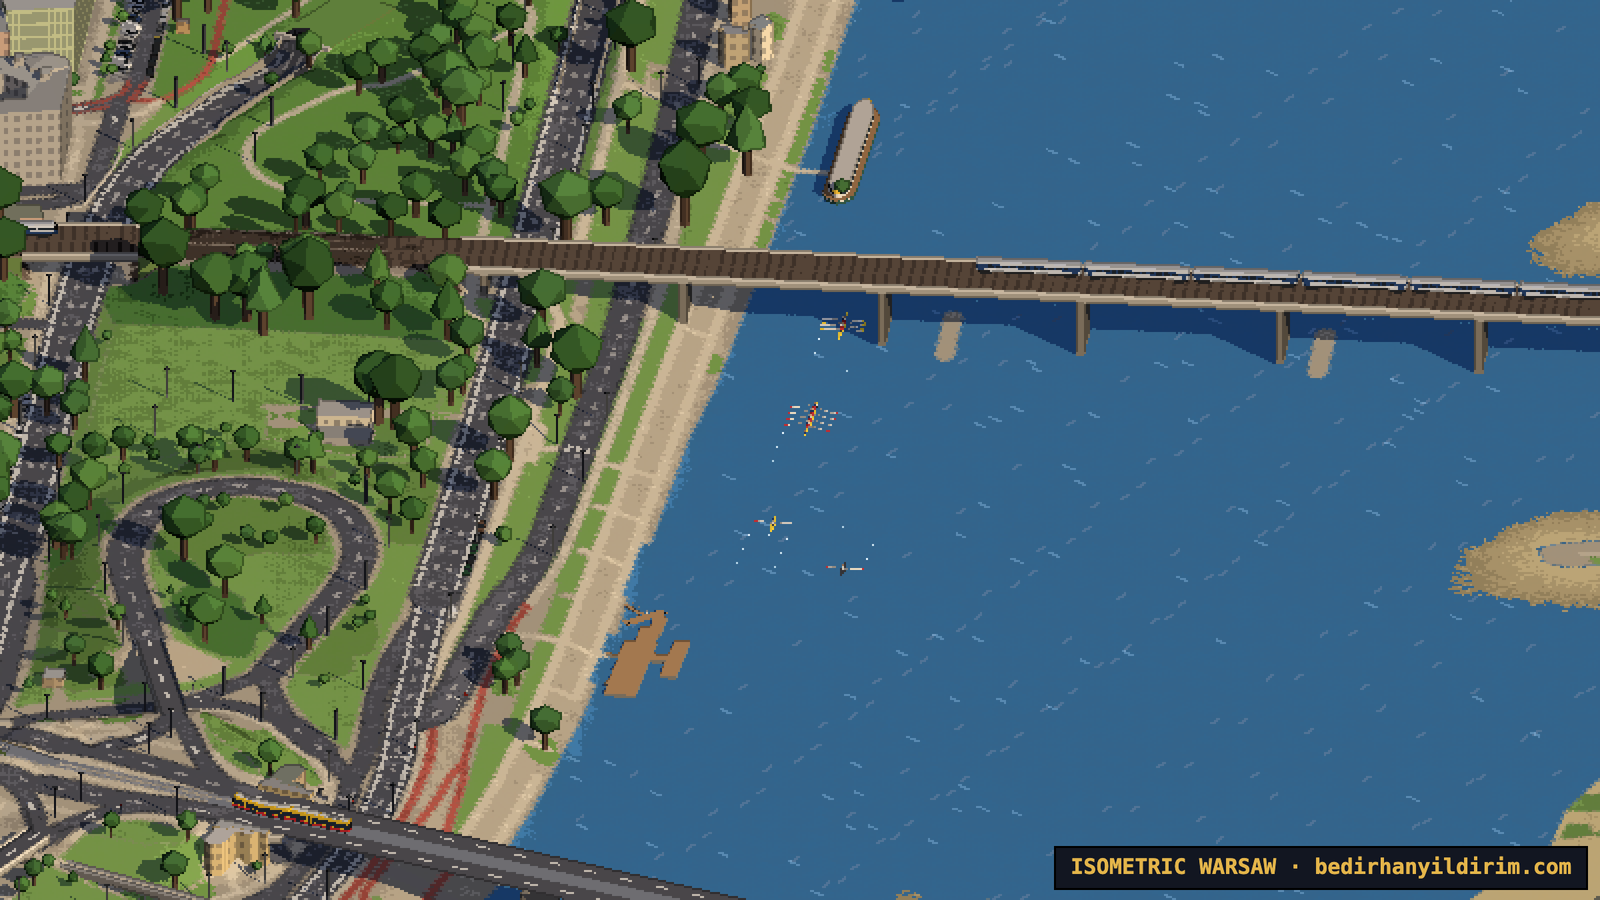
The rowing and canoe clubs along the river are there, with their boathouses and landing stages: WTW, the oldest rowing club in Warsaw, Port Czerniakowski, Port Praski and others. On summer mornings and evenings you will see single sculls and eights with their coach boat, kayaks in small groups, a few motorboats, and a couple of times a day the tourist boat leaving from the boulevards. Nobody is out at night, in winter or during a flood.
The real sun, the seasons and the night
You can pick any date and time, and the sun is where it really is over Warsaw. The shadows fall in the right direction and have the right length: short at noon in June, long in December, pointing west in the morning and east in the evening.
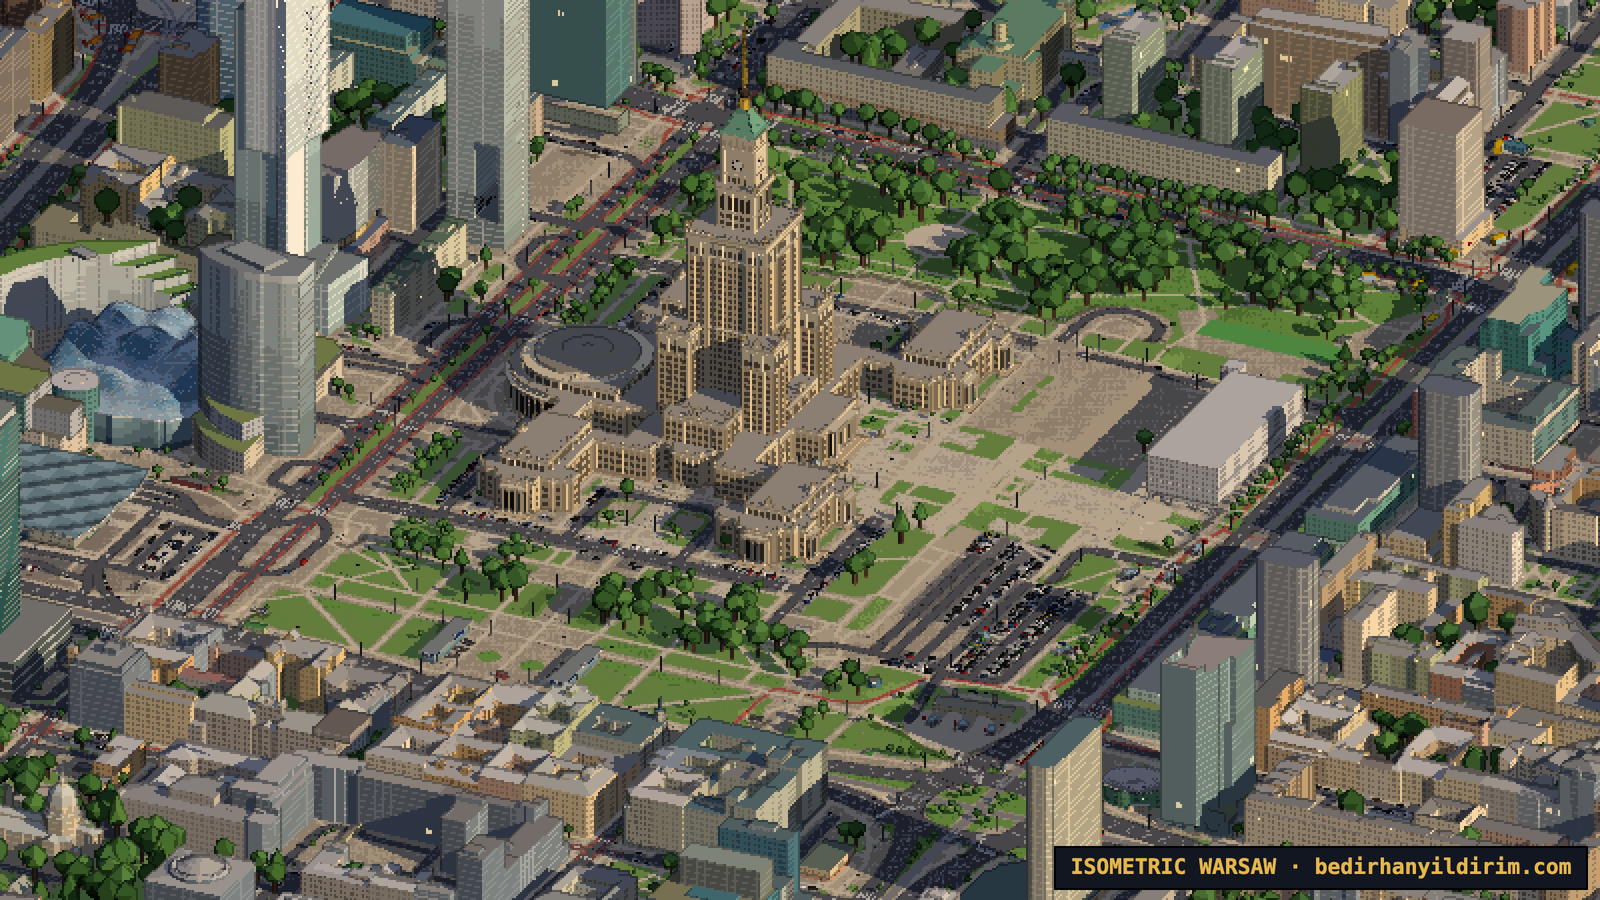
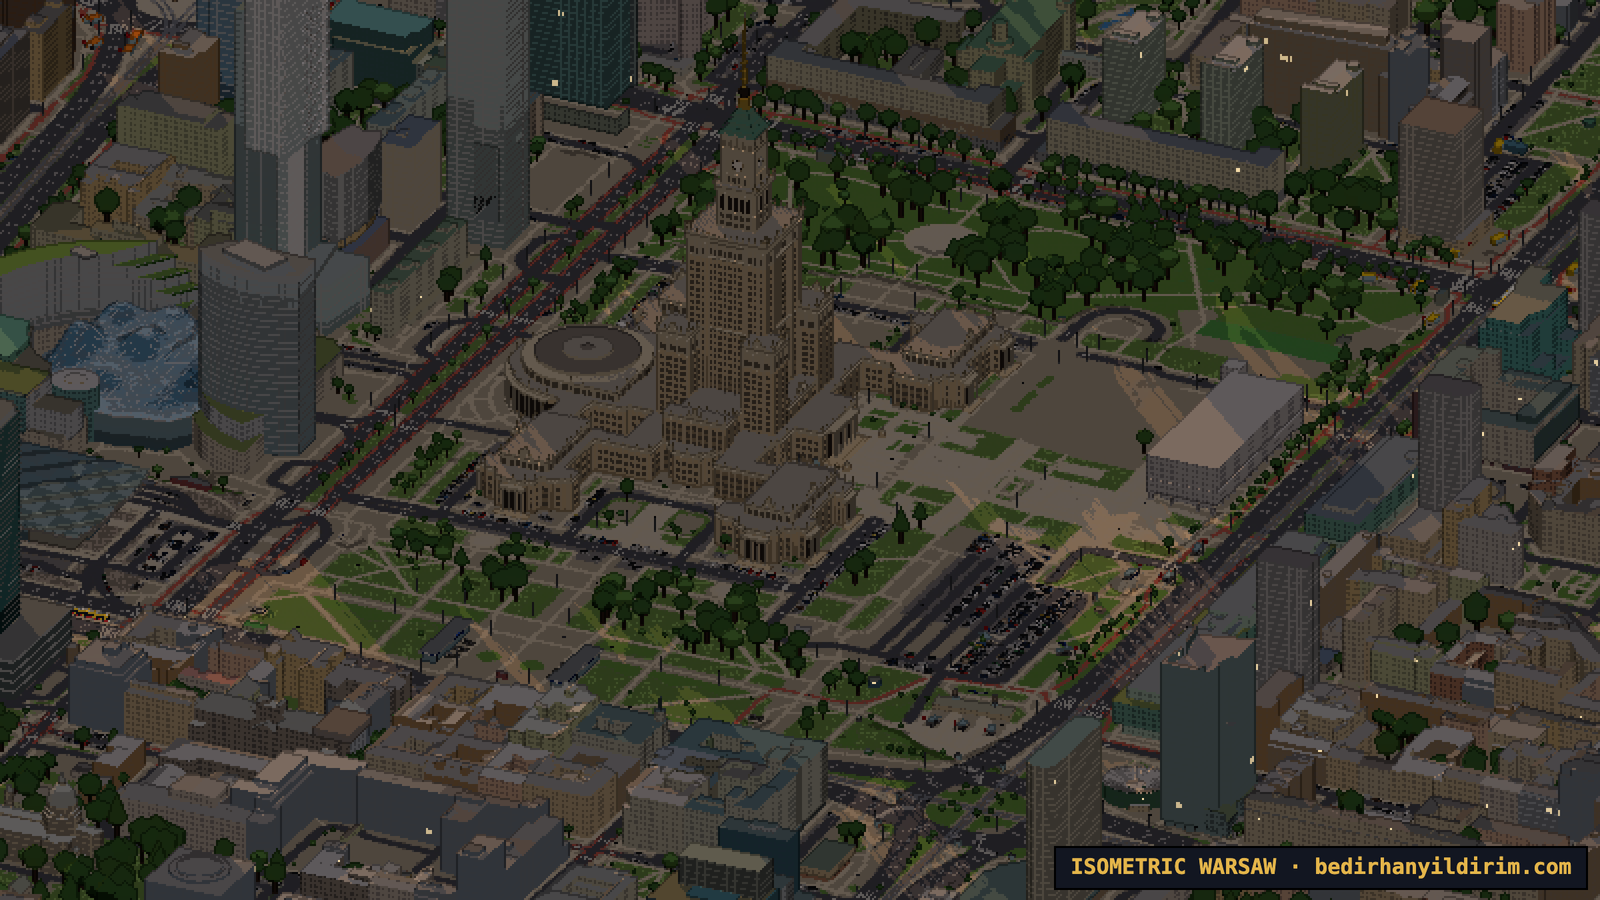
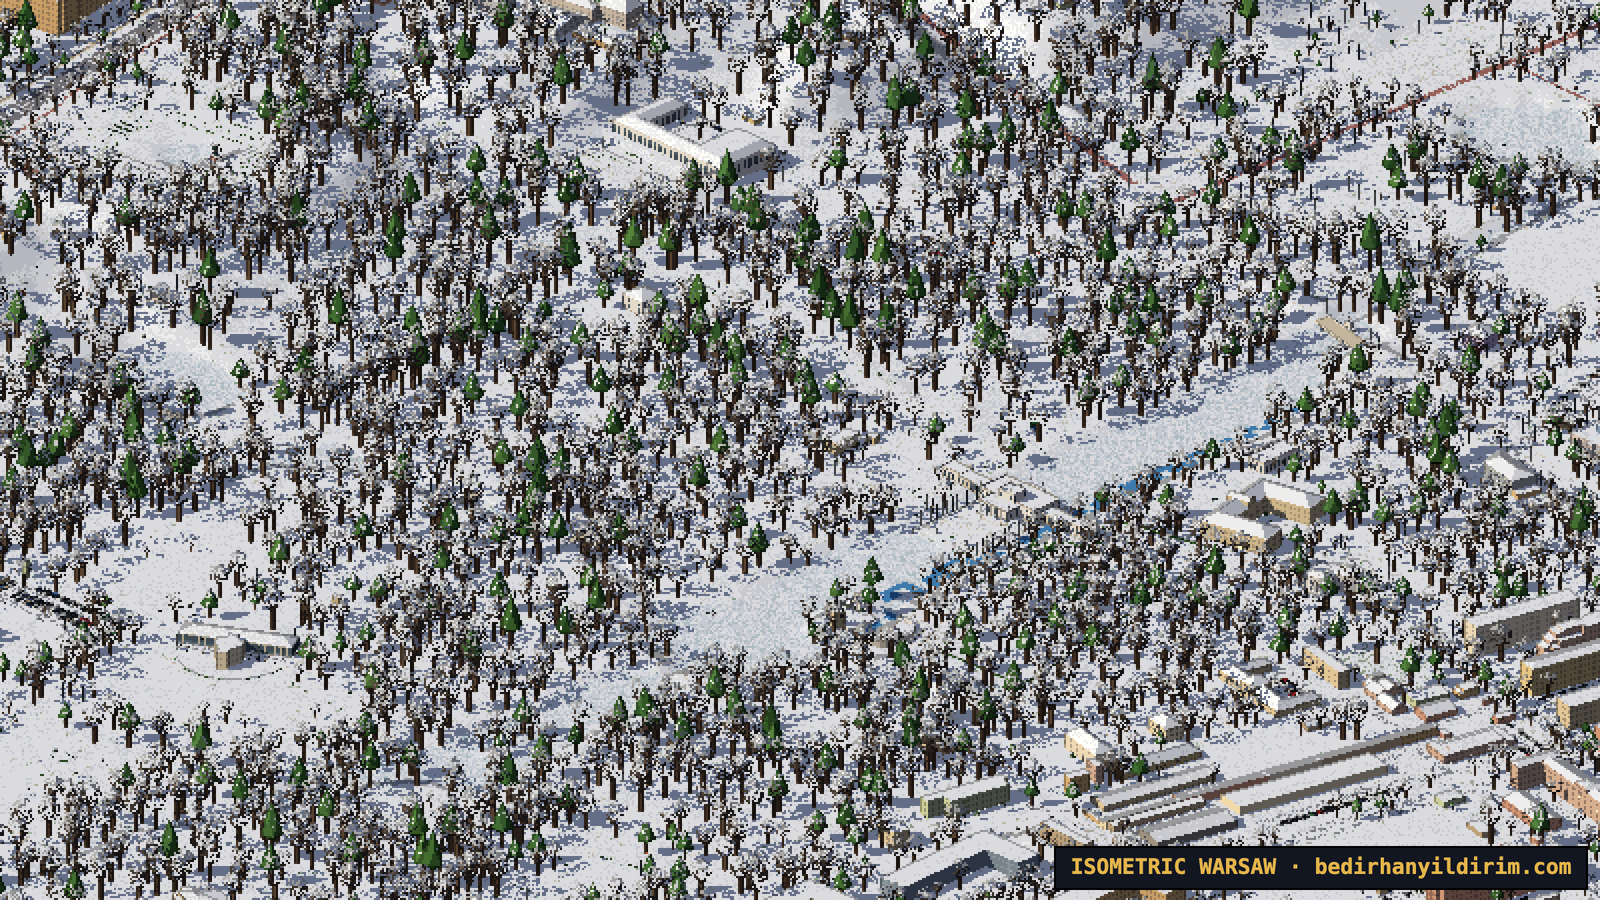
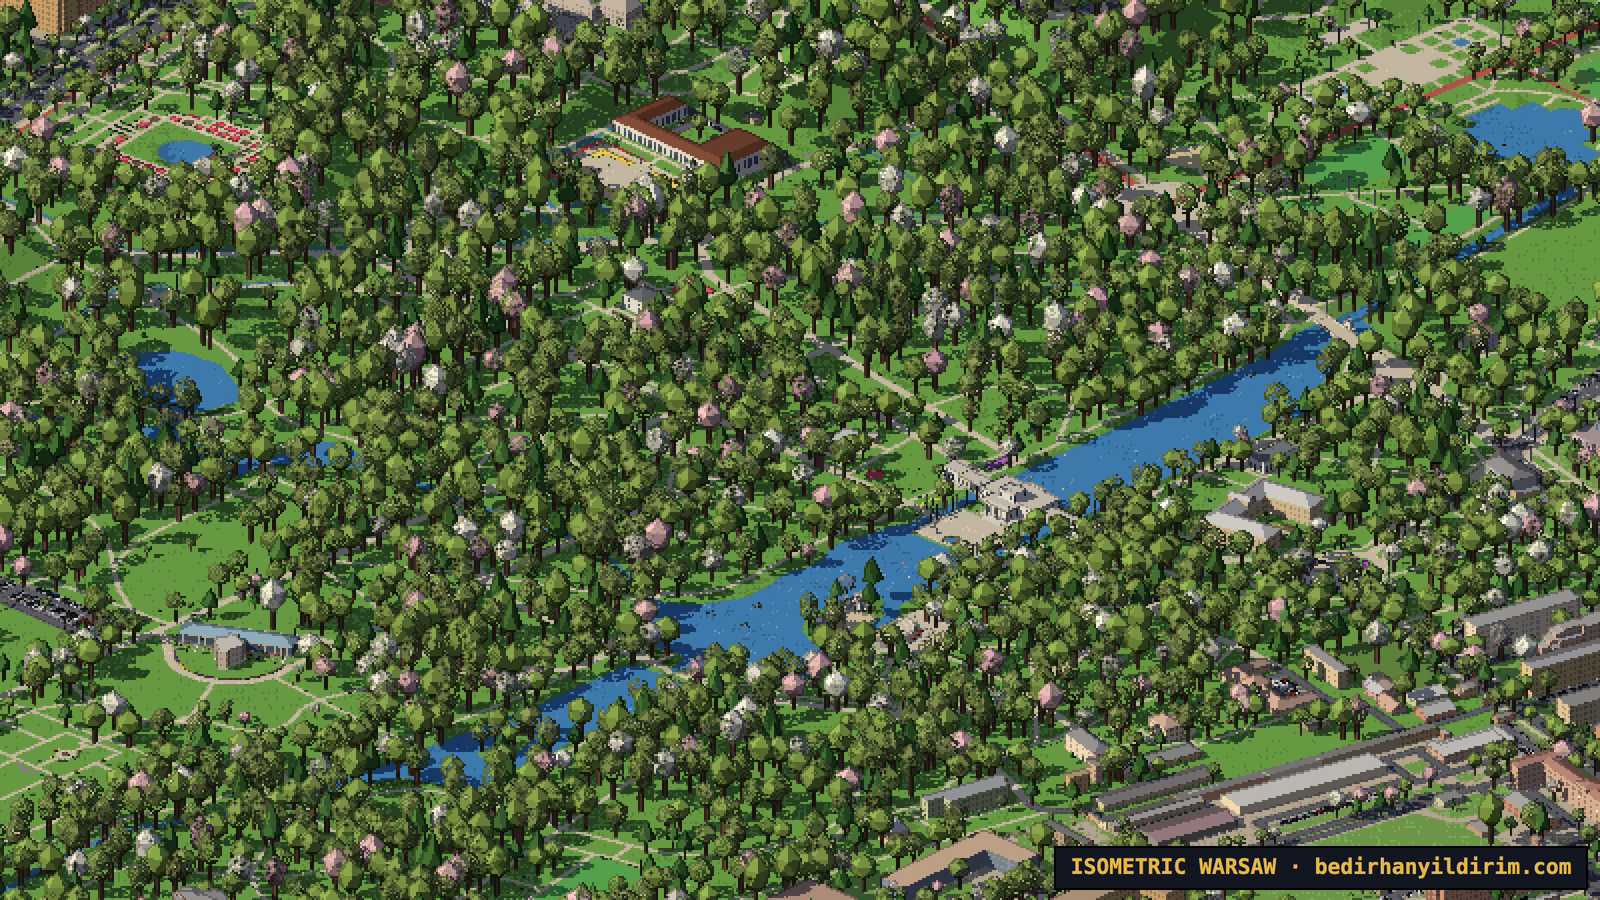
The map also follows the seasons. In winter there is snow on the roofs and the parks, the trees are bare and the ponds freeze. In April some trees blossom. In October the parks turn yellow, orange and red, while the conifers stay green.
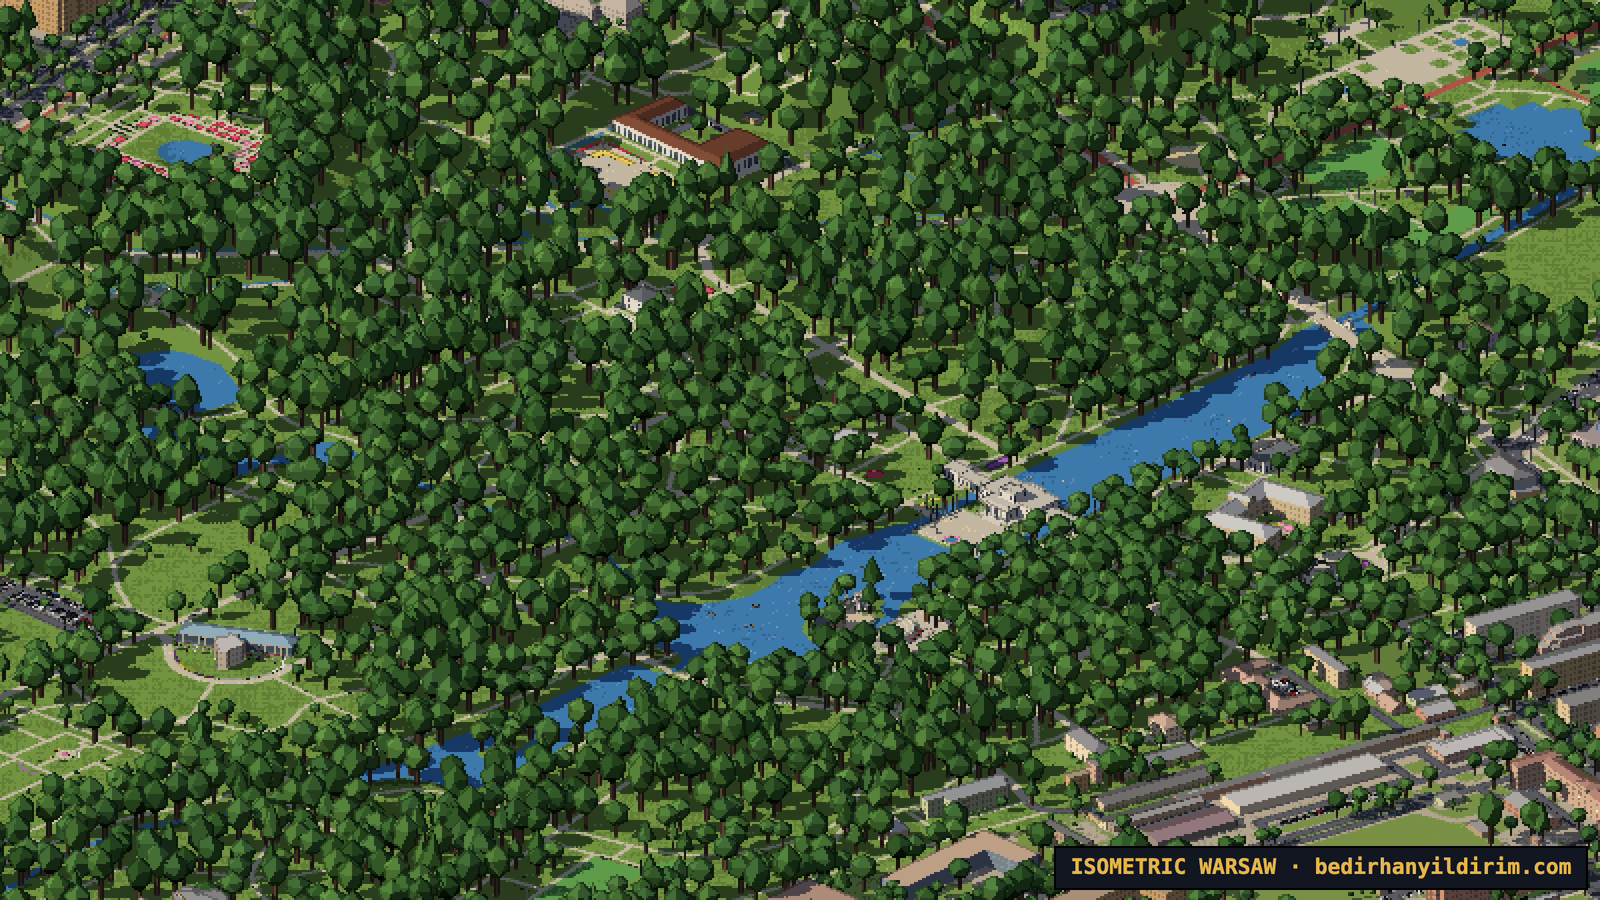
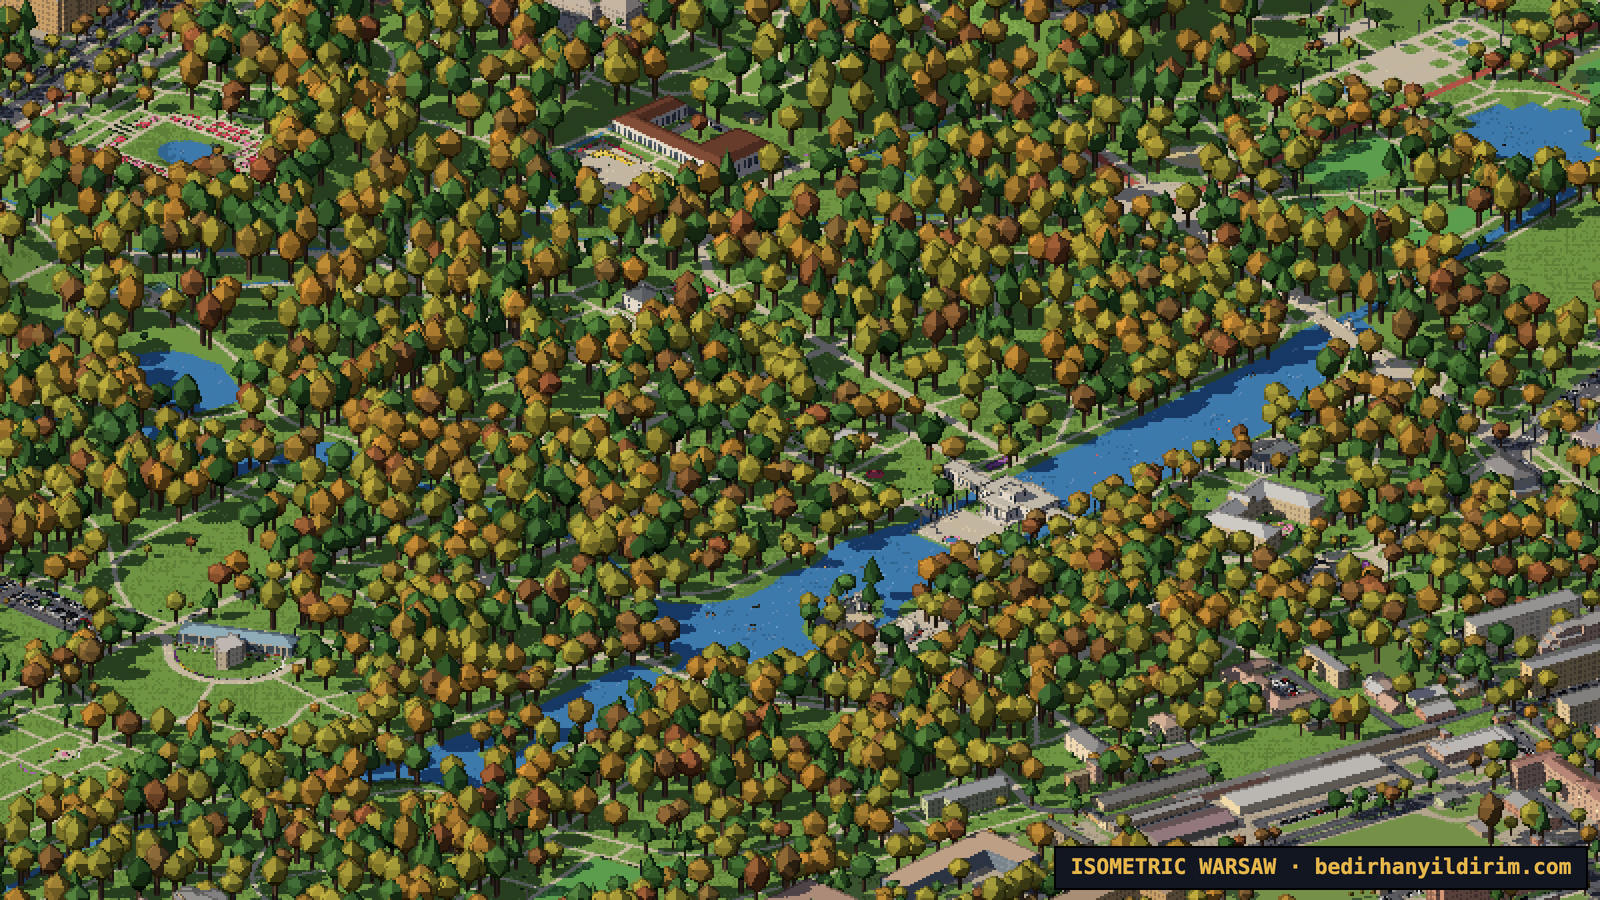
At night windows light up and 46,873 street lamps come on, all at their real positions from OpenStreetMap. This is my favourite view.
How to explore the map
On a computer:
- Drag with the mouse, or hold W A S D or the arrow keys to move around.
- Scroll, or press + and −, to zoom in and out.
- Hold Q or E, drag with the right mouse button or with Shift, or swipe sideways on a trackpad to rotate the city.
- G snaps the view back to the classic isometric angles.
- I opens the info panel with all data sources, Esc closes it.
- Click a landmark to open its card. Right-click without moving to save the current view as a picture.
- The sun panel in the top right corner switches between the artistic light and the real sun, and lets you choose the date, the time, the season and the water level of the Vistula.
On a phone: drag with one finger, pinch to zoom, turn with two fingers, double-tap to zoom in, and long-press to save a picture.
Making it fast enough for a phone
At first the whole city was a lot of data. The first version took 7.6 seconds to show the centre on a fast 4G connection; the whole city took 45 seconds. We packed the data into a compact binary format, compressed it with Brotli, loaded the squares under the screen first and everything else later. Now the centre appears in about 1.8 seconds on desktop and 1.1 seconds on an iPhone-sized screen.
It also works with touch: one finger to pan, pinch to zoom, two fingers to rotate.
Putting it online
My website runs on WordPress at Hostinger. The map is just a folder of static files next to WordPress, so WordPress never even sees those requests. Even the deployment had its own little drama: the server sent the JavaScript files with the wrong type, so the browser refused to run them. One line in an .htaccess file later, it worked.
What I learned
- You don’t always need an image model to get a hand-made look. Good data and a strict pixel-art renderer go a long way, and they are free.
- Open data is a superpower. Poland’s GUGiK data made this possible. Without it, the roofs, the terrain and the trees would all be guesses.
- Look at the result, not the report. Agents are good at saying “done”. The real test was always a screenshot.
- Say what you don’t want. No invented details, no brand logos, nothing that is not in the data. Saying this clearly mattered as much as saying what I wanted.
Try it
The map is at bedirhanyildirim.com/warsaw-izo. Right-click (or long-press on a phone) to save the current view as a picture. Press the ⓘ button for all data sources.
If you find a bridge that looks absurd or a landmark that deserves more detail, tell me on social media. There is always one more thing to add.


